by Chris Kimble | Jan 15, 2014 | Kimble Charting, Sector / Commodity
CLICK ON CHART TO ENLARGE Ever heard of the idea of buy low & sell higher? Believe in it? If not quit reading now! If you do believe in the idea of buy low & sell higher or believe in buying assets that are out of favor, the above chart might be of...

by Chris Kimble | Jan 14, 2011 | Kimble Charting
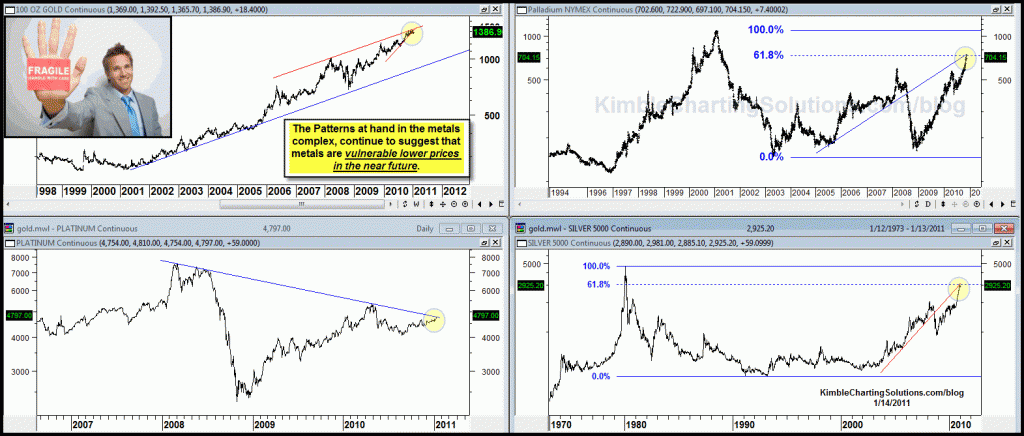
On 1/4, the “Power of the Pattern” suggested that “challenges were ahead” in the metals complex. (see post here) What has happened in the past 10 days per the metals? See below for an update. CLICK ON CHART TO ENLARGE Of...

by Chris Kimble | Jan 7, 2011 | Kimble Charting
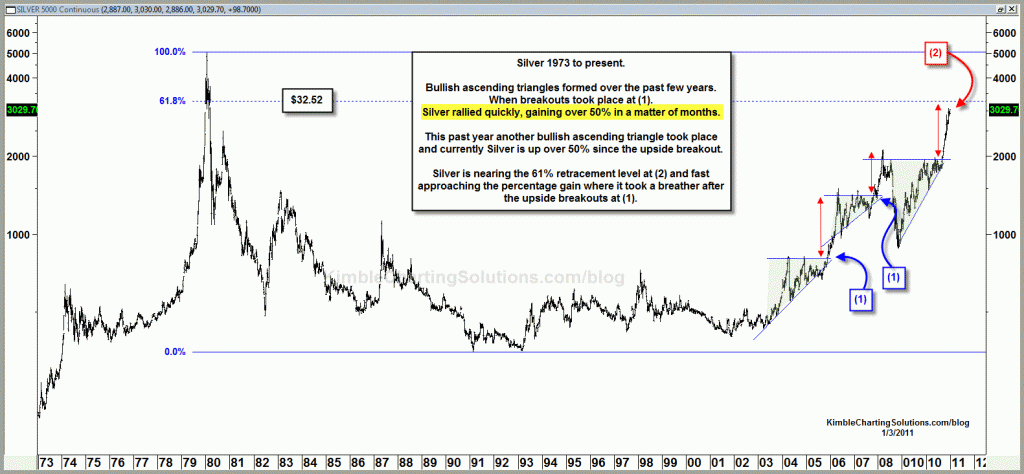
CLICK TO ENLARGE Monday afternoon I shared in the chart above, that Silver has reached a percentage gain that often saw it run out of gas (see post here) The following day gold lost over $40 per ounce and Silver gave back almost 5% in a...

by Chris Kimble | Jan 4, 2011 | Kimble Charting
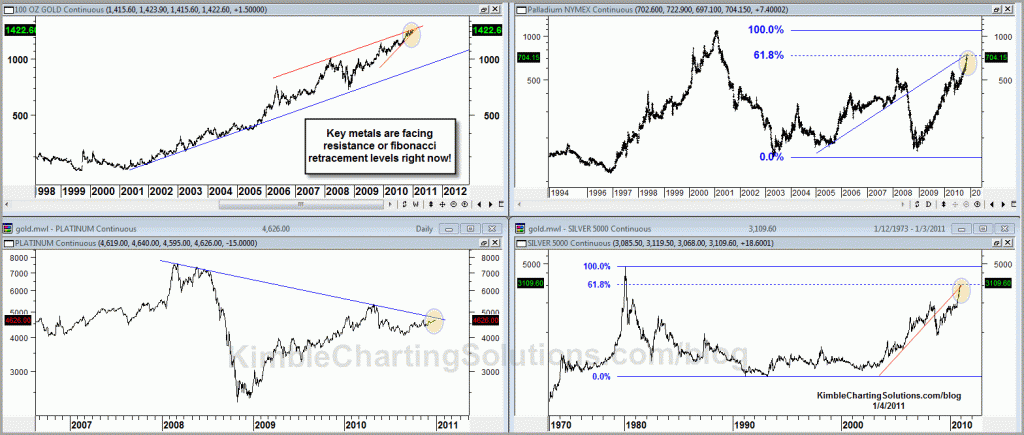
CLICK ON CHART TO ENLARGE Key precious and industrial metals find themselves facing key resistance after a stellar 2010. As I shared yesterday, the percentage gain that Silver (see post here) has made after the breakout, is where Silver ran...

by Chris Kimble | Nov 10, 2010 | Kimble Charting
Just a reminder, I am not a Bull or a Bear, just attempting to help investors “inflate portfolios regardless of market direction!” Several precious/industrial metals have done great over the past several months. CLICK ON CHART TO ENLARGE If you are long...

by Chris Kimble | Oct 26, 2010 | Kimble Charting
Wanted to “look outside” of the Gold/Silver complex for potential clues about basic metals and maybe the economy. Below is a current snapshot of Palladium. Palladium is facing Fibonacci 50% retracement resistance at the top of a rising wedge and a...


