
by Chris Kimble | Jul 10, 2013 | Kimble Charting
CLICK ON CHART TO ENLARGE Whether you rent or own Real Estate, the direction of Real Estate values is very important to the health of the overall economy! Unless you liver under a rock, I’m not telling you anything new when I share that the weakness in Home...
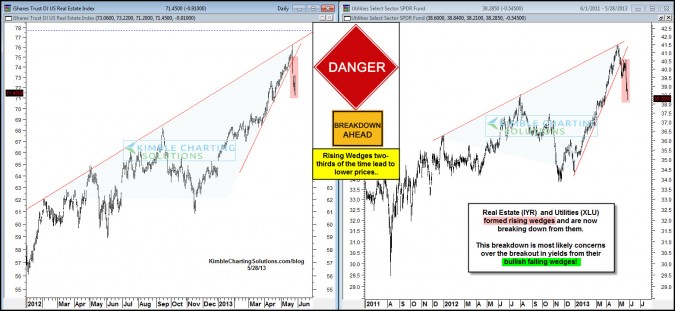
by Chris Kimble | May 29, 2013 | Kimble Charting
CLICK ON CHART TO ENLARGE These high flying yield plays formed bearish rising wedge, which two-thirds of the time suggest lower prices are ahead. Reit ETF (IYR) and Utilities ETF (XLU) are breaking down from these bearish patterns. ...

by Chris Kimble | May 20, 2013 | Kimble Charting
CLICK ON CHART TO ENLARGE Banks & Home builders lost nearly 80% in value at the 2009 lows. Dr Ben has doing a variety of “operations” to get these sectors back to health. Both Banks and Home builders faced the 38% Fibonacci retracement level of...

by Chris Kimble | Feb 20, 2013 | Kimble Charting
CLICK ON CHART TO ENLARGE What sector had a major impact on the economy and stock market from 2006 to 2009? Home Construction Index… as it fell 90% in price in a few years. What sector has been very hot of late and might have helped pull the broad...

by Chris Kimble | Jan 30, 2013 | Kimble Charting
CLICK ON CHART TO ENLARGE Real Estate ETF (IYR) and Transports (IYT) have been sizzling hot over the past 6 months, gaining two/three times as much as SPY. The rallies have both of these up against key tests of resistance right now. Are these two done enough for...

by Chris Kimble | Jan 11, 2013 | Kimble Charting
David Rosenberg wrote an article and produced the chart below, making the case that Homebuilder stocks look more overvalued now than they did at the housing bubble peak (see article here) CLICK ON CHART TO ENLARGE I will leave the valuation part to David and other...

by Chris Kimble | Nov 15, 2012 | Kimble Charting
CLICK ON CHART TO ENLARGE Unless one lives in a cave, most everyone knows Real Estate had a good deal to do with the economic and stock market weakness in 2007 & 2008. The DJ Home Construction index was a great “leading indicator” for the economy...

by Chris Kimble | Nov 12, 2012 | Kimble Charting
CLICK ON CHART TO ENLARGE DJ Home Construction Index finds itself at Fibonacci 161% Extension level and rising resistance in the chart above. ITB is the ETF to watch here! A break below the bearish rising wedge could be very hard on Homebuilders and support is...
