
by Chris Kimble | Oct 23, 2012 | Kimble Charting
CLICK ON CHART TO ENLARGE The hot flying Real Estate ETF (IYR) may have created a “Bearish Head & Shoulders” topping pattern at its 61% Fibonacci retracement level of late. The “Power of the Pattern” suggested for Premium and...

by Chris Kimble | Oct 2, 2012 | Kimble Charting
CLICK ON CHART TO ENLARGE Shared this chart with Premium and Sector Sentiment Members last week. The 2-pack reflects that the DJ Home construction index is up against a couple of resistance lines, a Fibonacci extension level at (1) and the relative momentum index is...
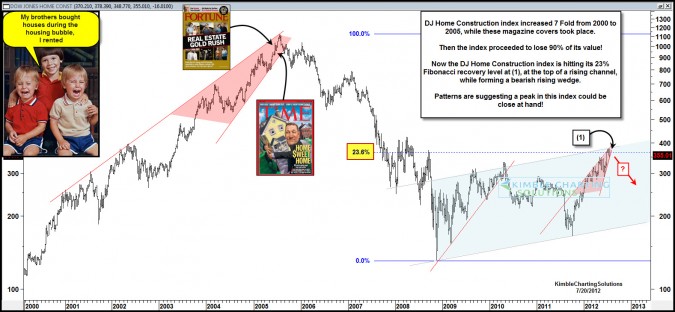
by Chris Kimble | Jul 20, 2012 | Kimble Charting
CLICK ON CHART TO ENLARGE The Dow Jones Home Construction index rallied over 700% from 2000 to 2005, then it proceeded to lose 90% of its value in the following three years. This is a prime example of the effects of an Eiffel tower pattern. (see post here) Since...
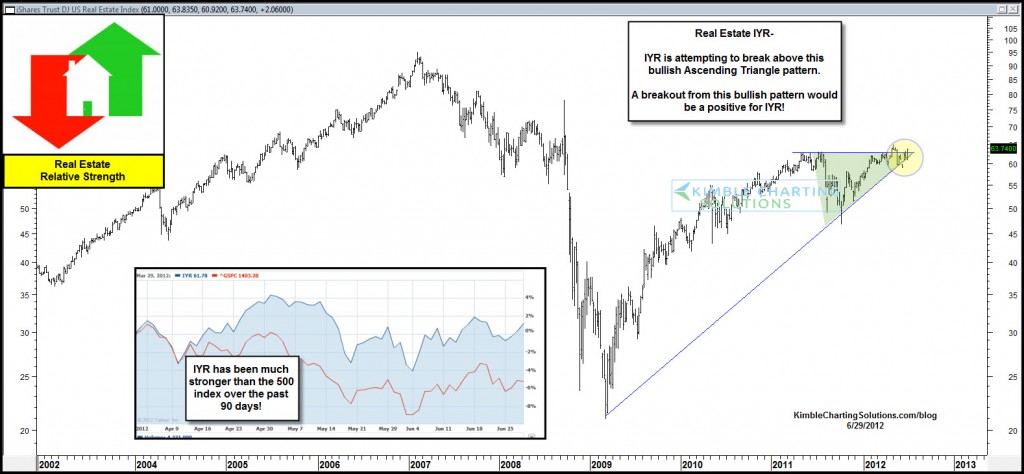
by Chris Kimble | Jun 29, 2012 | Kimble Charting
CLICK ON CHART TO ENLARGE Real Estate ETF (IYR) looks to be forming a bullish ascending triangle over the past few months and has performed much better than the 500 index over the past 90 days. Odds favor an upside breakout from this pattern and IYR should continue to...

by Chris Kimble | Apr 18, 2012 | Kimble Charting
CLICK ON CHART TO ENLARGE It’s paid off to own the Financials/Regional Banks, Real Estate and Homebuilders the past 6-months, as they have taken on a leadership role and outperformed the S&P 500 by a wide margin, reflected in the chart above. Below is...

by Chris Kimble | Jan 25, 2012 | Kimble Charting
The “Power of the Pattern” highlighted back on November 30th, that Basic Materials ETF (IYM) had created what looked like a Bullish Head & Shoulders Pattern(see post here) Did any of you laugh or say NO WAY, that a bullish pattern was...

by Chris Kimble | Jan 17, 2012 | Kimble Charting
CLICK ON CHART TO ENLARGE You might be hard pressed to find an index that lost more than the DJ Home Construction Index did from 2005 to 2008. This index was almost “Crushed” as it lost over 85% of its value during the 3+ year decline. The...
by Chris Kimble | Feb 1, 2011 | Kimble Charting
Last week, patterns reflected that REIT ETF (IYR) and Homebuilder (XHB) were both facing key resistance. (see post here) CLICK ON CHART TO ENLARGE Above is an update to the IYR chart, which reflects that IYR is still facing key resistance. Price level (1) was...
