by Chris Kimble | Nov 16, 2020 | Kimble Charting
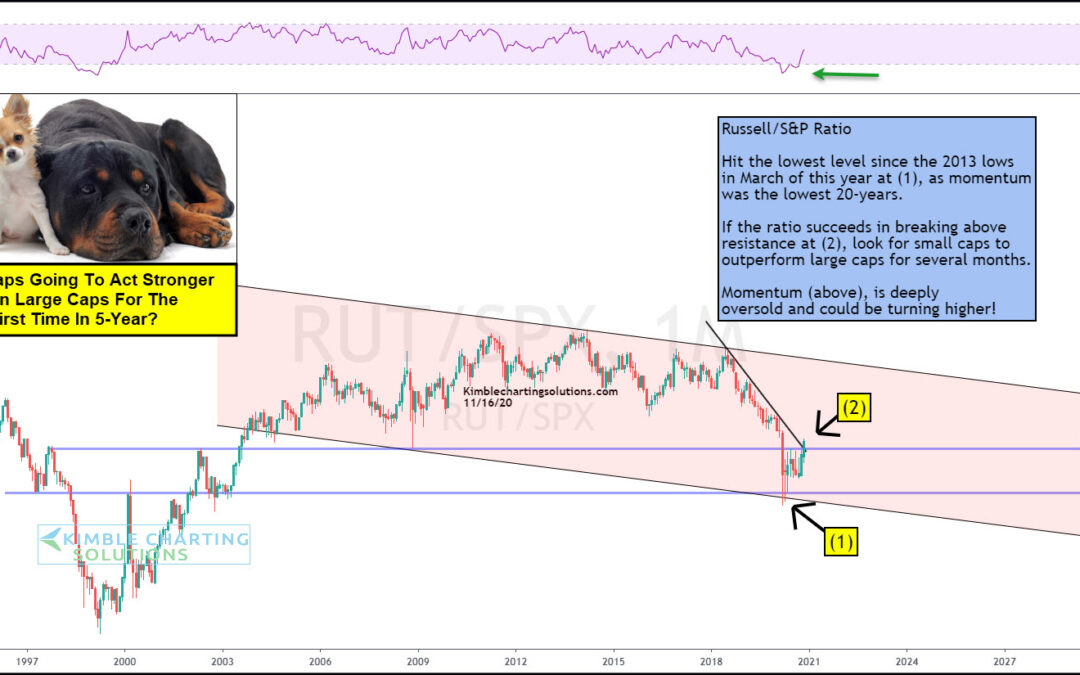
Small-cap stocks have underperformed large-cap stocks by a significant degree over the past 5-years. This weakness since the highs in 2015, has the Russell/S&P ratio hitting the lowest level in the past 15-years at (1), earlier this year. The rally off long-term...

by Chris Kimble | Apr 9, 2015 | Kimble Charting
CLICK ON CHART TO ENLARGE The Power of the Pattern shared last October that the Russell 2000/S&P 500 ratio was on multi-year support, as small caps had been weaker than large caps for the prior 10-months. The ratio on support was suggesting this pair trade- Long...

by Chris Kimble | Jan 9, 2015 | Kimble Charting
CLICK ON CHART TO ENLARGE The past year has been a little bit rough on small caps, as they have under performed against the SPY by almost 8% over the past 12 months. When looking back over the past few years, small caps haven’t lagged the S&P by that...
by Chris Kimble | Nov 19, 2014 | Kimble Charting
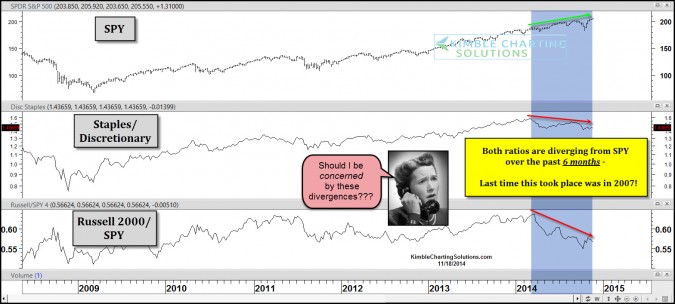
CLICK ON CHART TO ENLARGE Looking back at 2006/2007, several key market indicators started diverging from the S&P 500, before the large decline in 2007/2008 took place. The above chart compares the Staples/Discretionary and Russell 2000/SPY ratios against...
