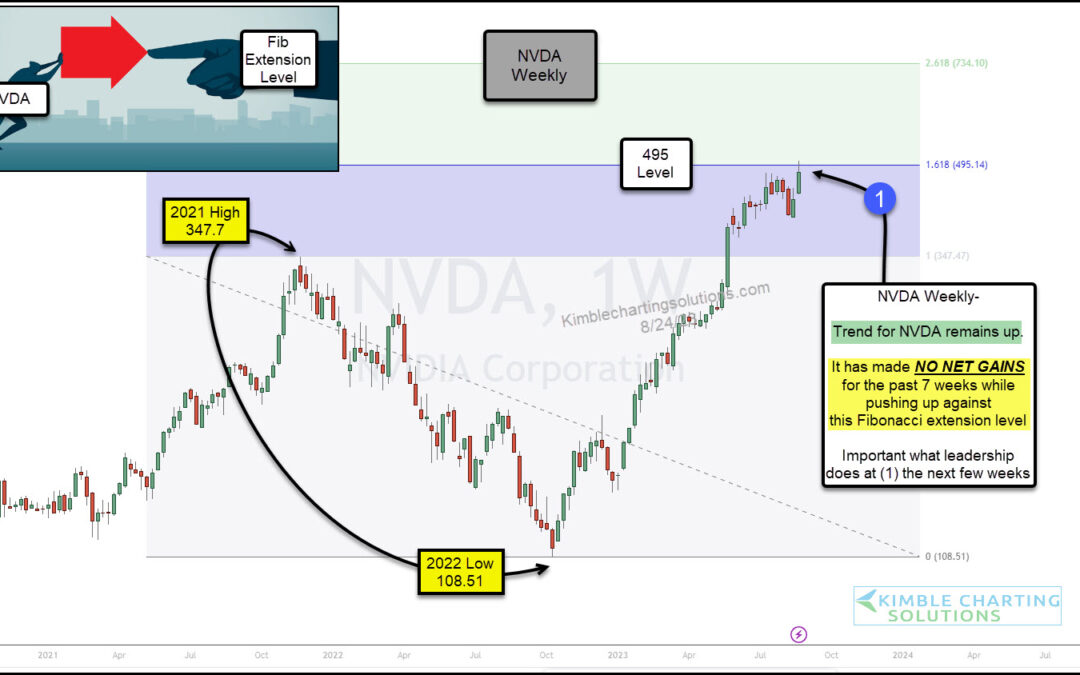
by Chris Kimble | Aug 25, 2023 | Kimble Charting
Today we discuss one of the technology sector’s darlings. It’s a market leader and a high-flier… it’s Nvidia (NVDA). The stock price recently surged after the company hit a homerun with their recent earnings announcement. But something important seems to be jumping...
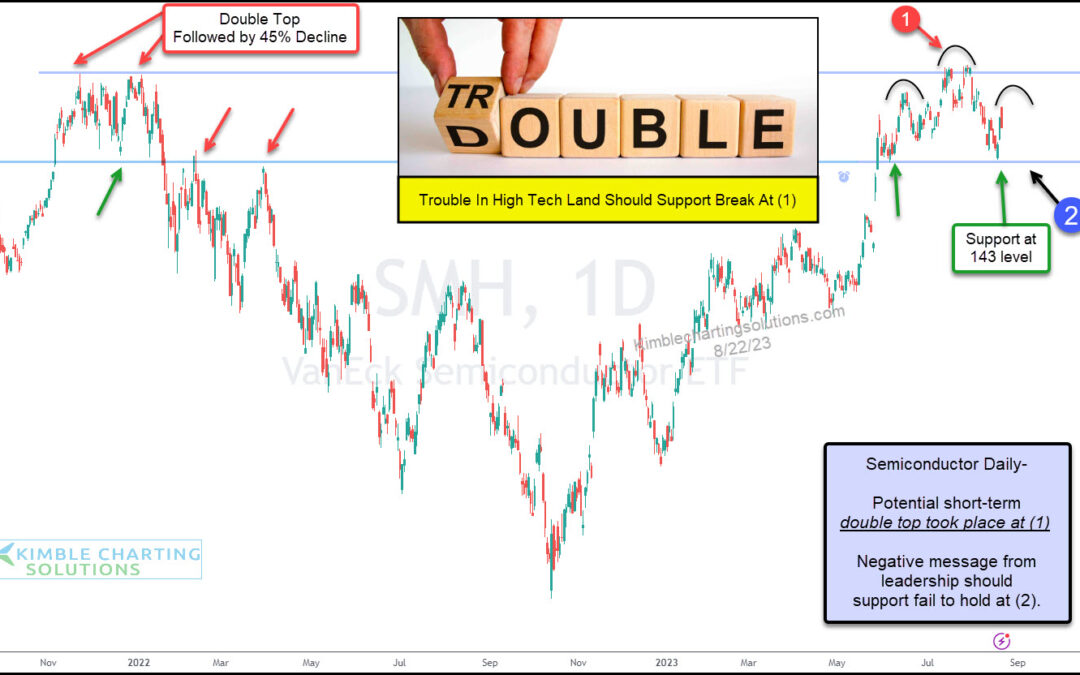
by Chris Kimble | Aug 23, 2023 | Kimble Charting
As readers know, we watch leadership sectors daily. And today is no different as we take yet another look at the Semiconductors (SMH). Below is a “daily chart of SMH showing the correction and subsequent rally. We have two very important price areas to watch that...
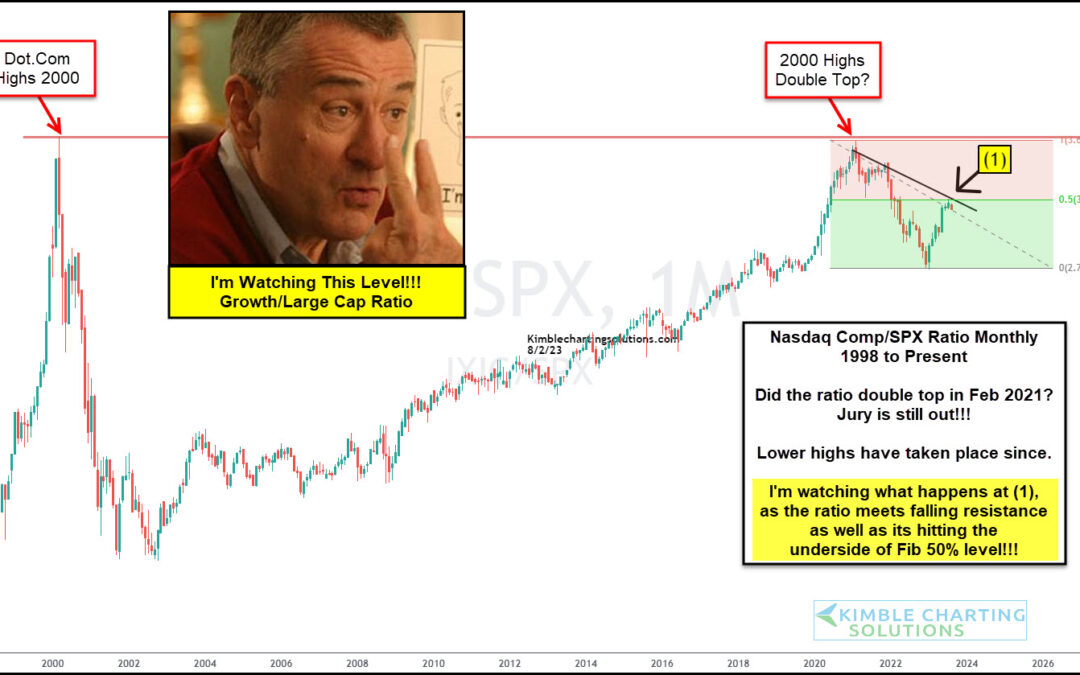
by Chris Kimble | Aug 3, 2023 | Kimble Charting
The main bank of stock market leadership has come from the technology sector. Let’s face it, tech stocks have been market leaders for years and a core driver of our economy. BUT the post-COVID Nasdaq performance versus the S&P 500 has not been great. The bright...
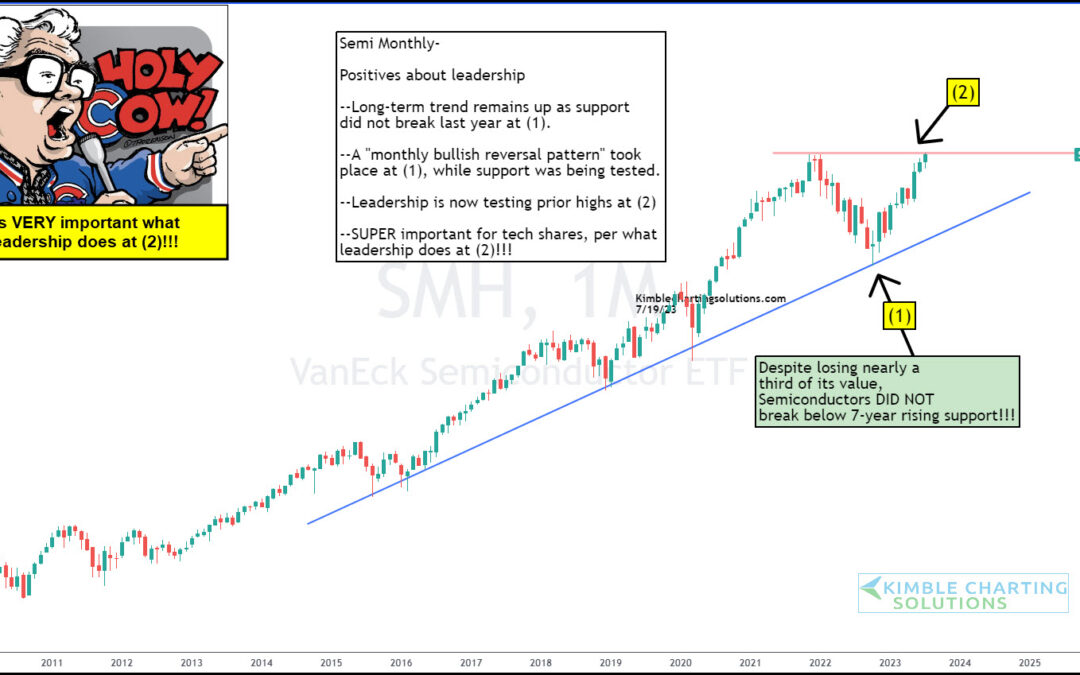
by Chris Kimble | Jul 20, 2023 | Kimble Charting
Over the years, we have consistently pointed out the importance of stock market leadership. The premise is simple. If a sector is out-performing, find strong stocks within that sector. If we are in a bull market, follow out-performing sectors (leaders) for clues about...
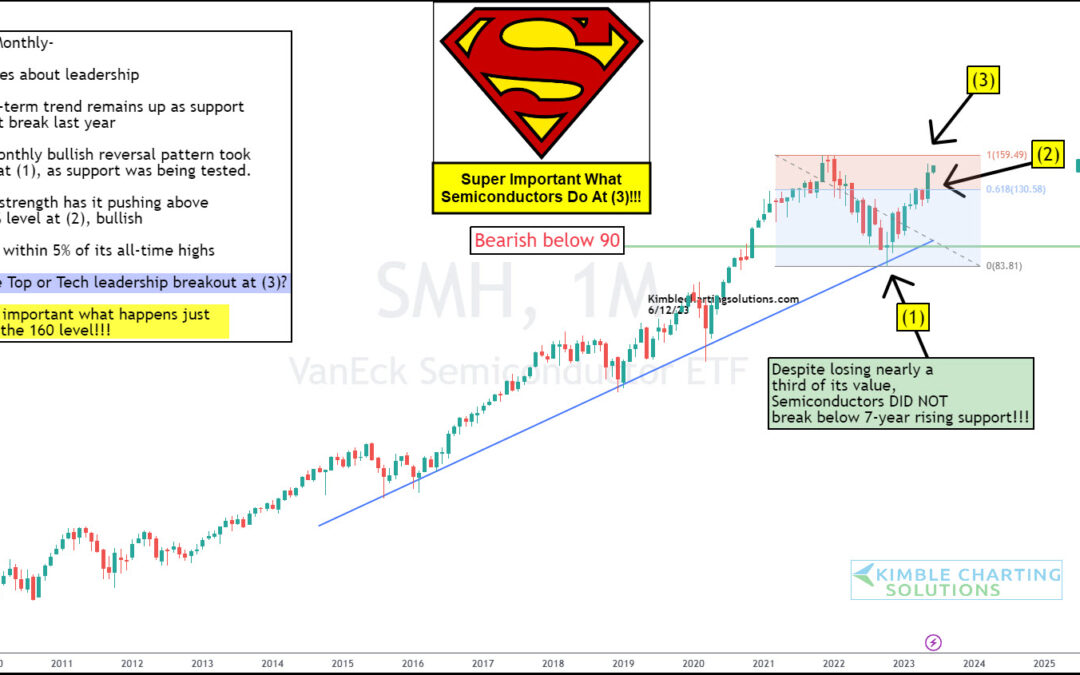
by Chris Kimble | Jun 14, 2023 | Kimble Charting
We often talk about the importance of leadership in the markets. For active investors, it tells us which sectors are out-performing and warns us when those sectors begin to falter. Today is a great example. Below is a long-term “monthly” chart of the Semiconductors...
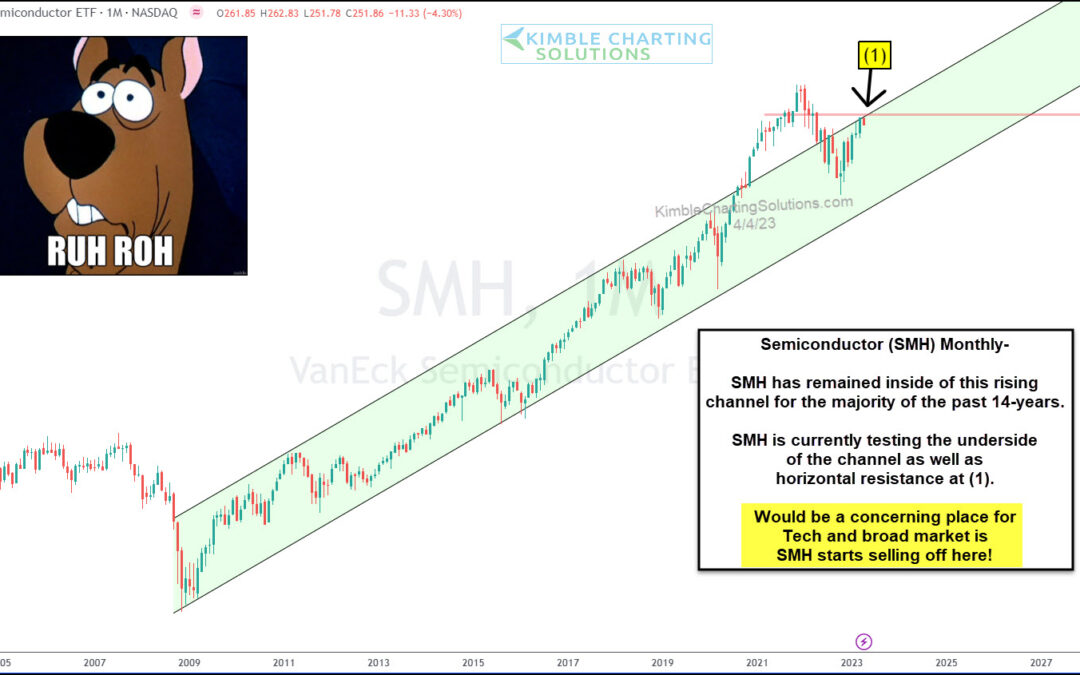
by Chris Kimble | Apr 10, 2023 | Kimble Charting
One of the bull market leaders of the past 14 years is trading into critical resistance. And what happens next could decide the next turn for tech stocks. That’s right, we are talking about Semiconductors… again. We have routinely highlighted key moments across...
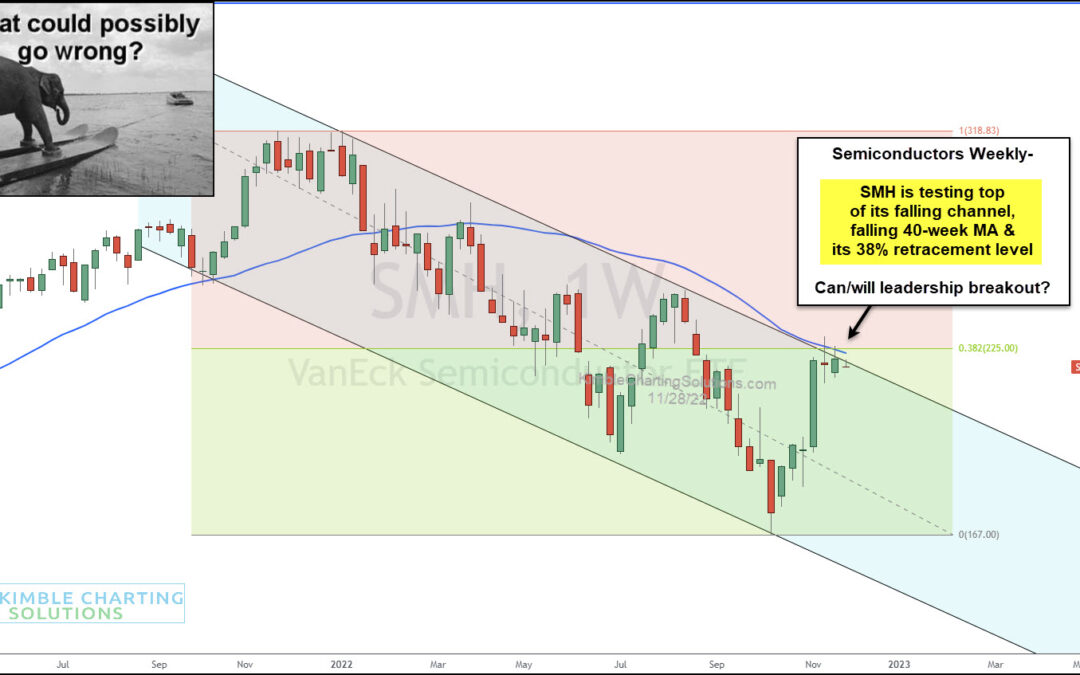
by Chris Kimble | Dec 8, 2022 | Kimble Charting
Technology stocks lead the broader stock market on the way up… and, more recently, on the way down. And within the technology arena, the same is true for the Semiconductors Sector (SMH). To better understand the market’s direction (or change of direction) we watch the...
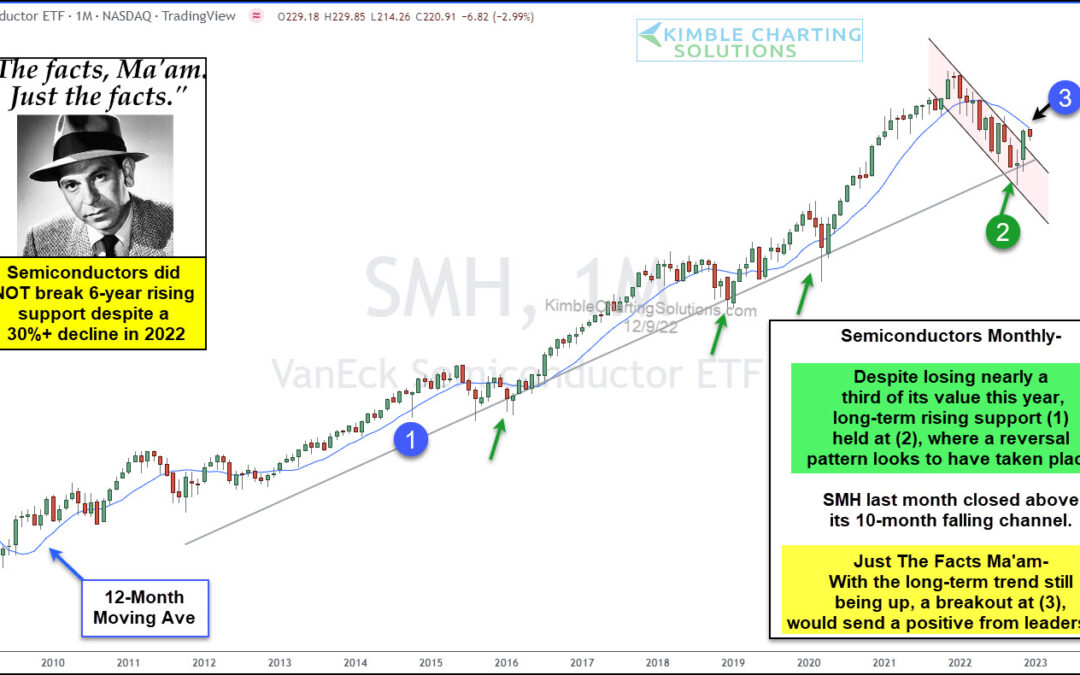
by Chris Kimble | Nov 29, 2022 | Kimble Charting
I sometimes get tired of reminding folks of the importance of technology stocks… and even more so, the Semiconductors Sector (SMH). The Semiconductor Sector (SMH) lead the bull market higher for well over a decade… but this year they have lead the market lower,...
