by Chris Kimble | Apr 13, 2020 | Kimble Charting
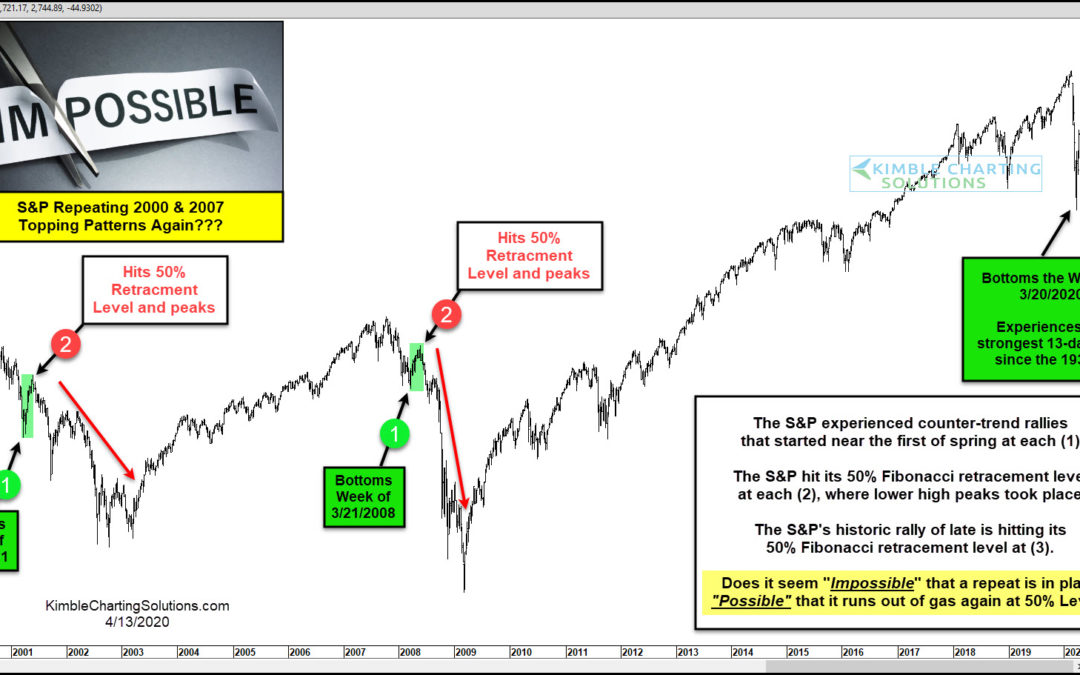
S&P 500 Index Chart Long-Term Chart Over the past two weeks, the stock market has rallied sharply, seeing the S&P 500 retraced 50 percent of the 2020 market crash. The quick burst higher has many feeling a sense of relief… but could this be an ominous sign? In...
by Chris Kimble | Apr 6, 2020 | Kimble Charting
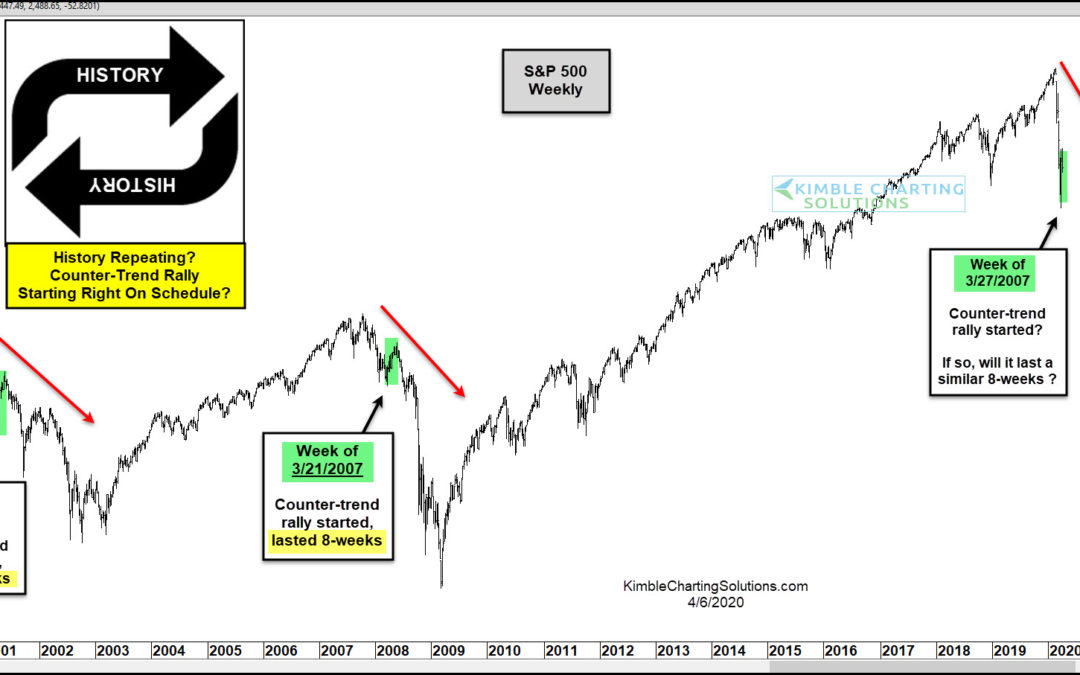
Does History Repeat? Is does rhyme sometimes!!! This chart looks at the S&P 500 on a weekly basis over the past 20-years. The S&P declined by 50% during the 2000-2003 bear market. On the week of 3/23/2001, it experienced its first counter-trend rally, which...
by Chris Kimble | Apr 1, 2020 | Kimble Charting
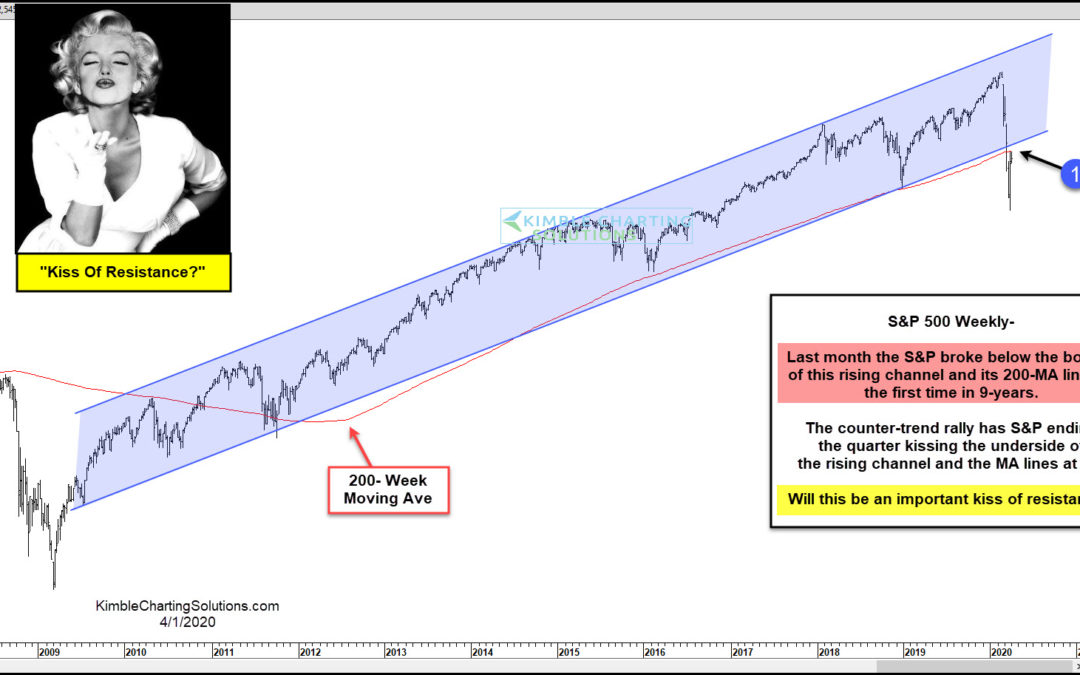
Is the S&P starting out a new month and quarter at a very important price point? This chart would say YES! This chart looks at the S&P 500 on a weekly basis over the past 12-years, reflecting that it has spent the majority of the past 9-years “inside of...
by Chris Kimble | Mar 11, 2020 | Kimble Charting
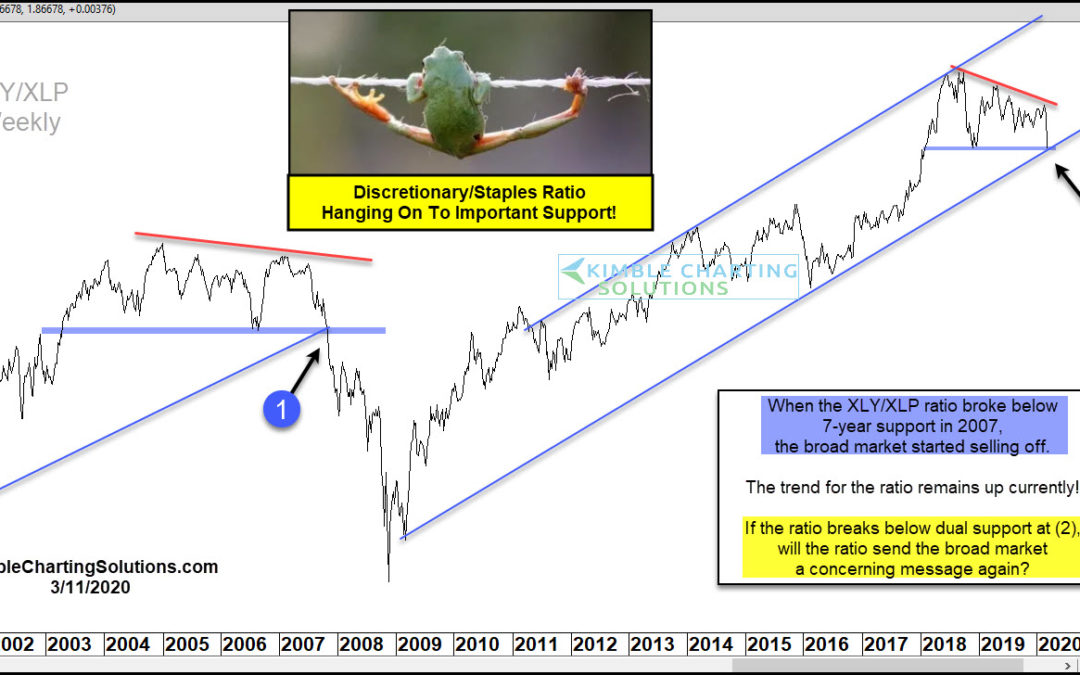
The Corona Virus seems to have people running to the stores to buy large amounts of certain staples (Toliet Paper, Paper Towels, Water). The chart looks at the Discretionary/Staples (XLY/XLP) ratio over the past 20-years. When investors started selling Discretionary...
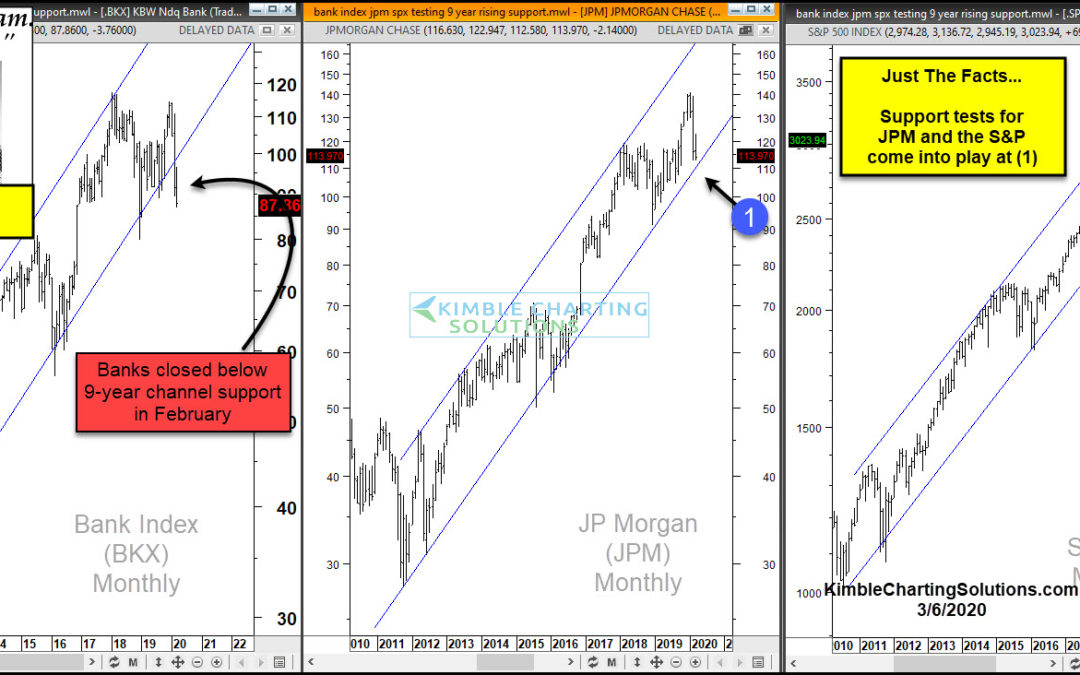
by Chris Kimble | Mar 6, 2020 | Kimble Charting
By now you are most likely aware that the S&P 500 just experienced its quickest 10% decline in its history. Did this decline break long-term rising channels? Check out the 3-pack above. This 3-pack takes a monthly look at the Bank Index (BKX), JP Morgan (JPM) and...
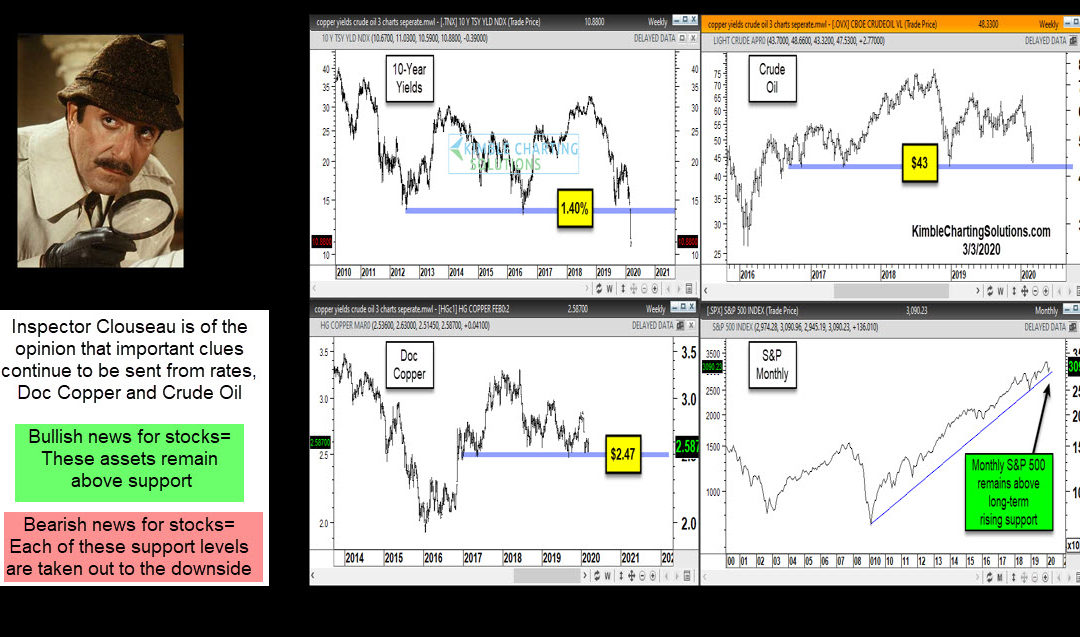
by Chris Kimble | Mar 3, 2020 | Kimble Charting
Will the economy experience a “Demand Shock?” Consumers stay at home and don’t buy many items. Will the economy experience a “Supply Shock?” Workers stay home and don’t create many products. Will a combo of both take place or...
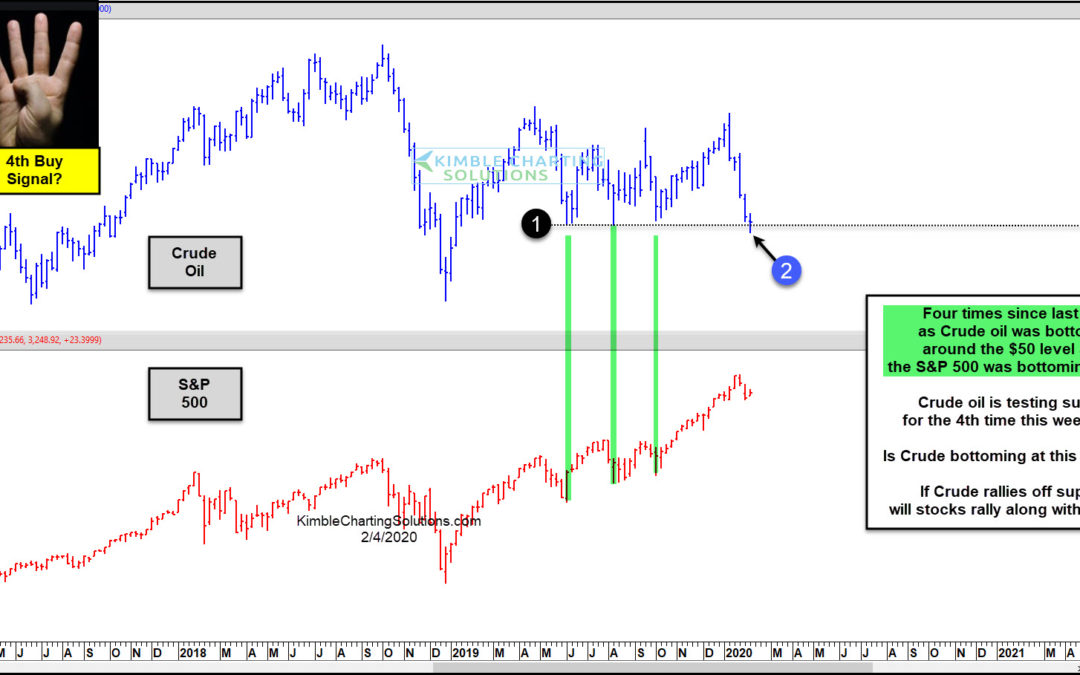
by Chris Kimble | Feb 4, 2020 | Kimble Charting
Is Crude Oil bottoming for the 4th time the last 8-months? Is Crude Oil suggesting that stocks are at a low about to experience a strong rally? Crude Oil has rallied off support line (1), which is the $50 level, three different times since May of 2019. Each time Crude...
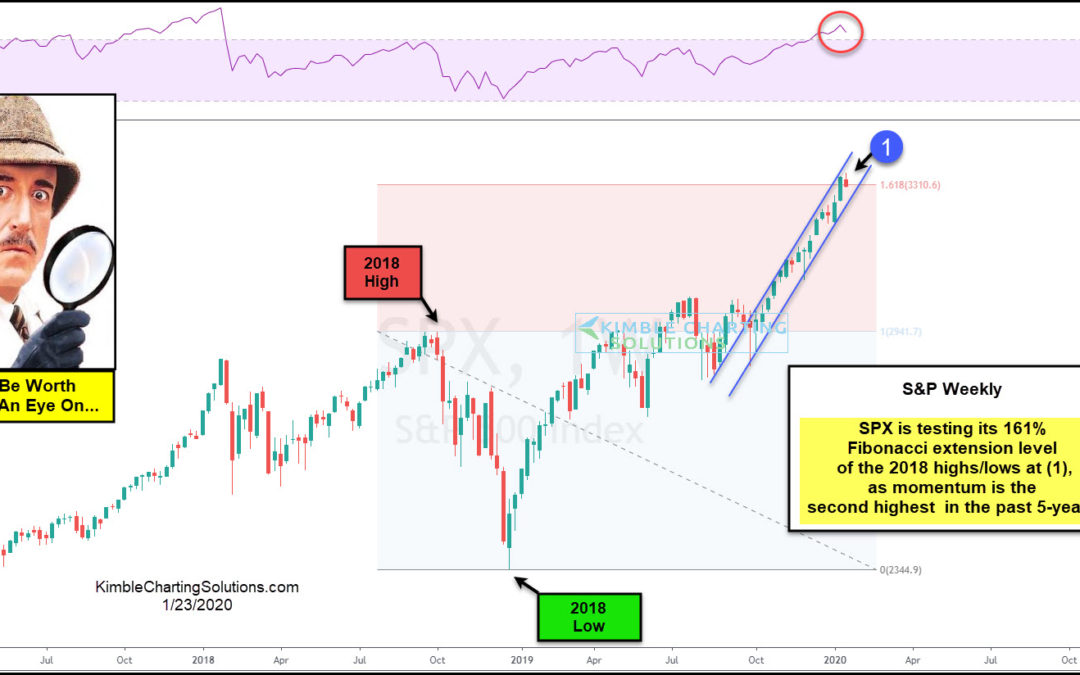
by Chris Kimble | Jan 23, 2020 | Kimble Charting
Some price points lend themselves to potential turning points. Is the S&P at one of those price points? The inspector suggests it is! This chart looks at the S&P 500 over the past couple of years. Fibonacci was applied to the 2018 highs and 2018 lows. The...
