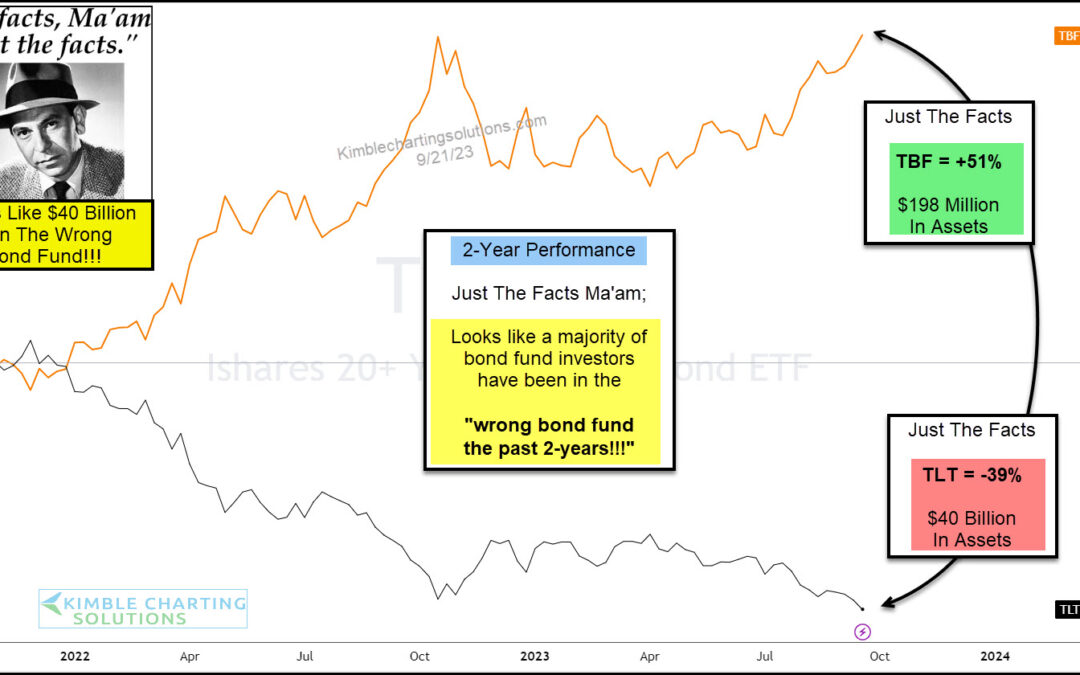
by Chris Kimble | Sep 22, 2023 | Kimble Charting
When treasury bond yields are rising, bond prices are falling. It’s an inverse relationship. And so it makes sense that the 20+ Year Treasury Bond ETF (TLT) has fallen sharply during the Federal Reserve’s rate hike cycle. “The Facts, Ma’am. Just the facts.” – Joe...
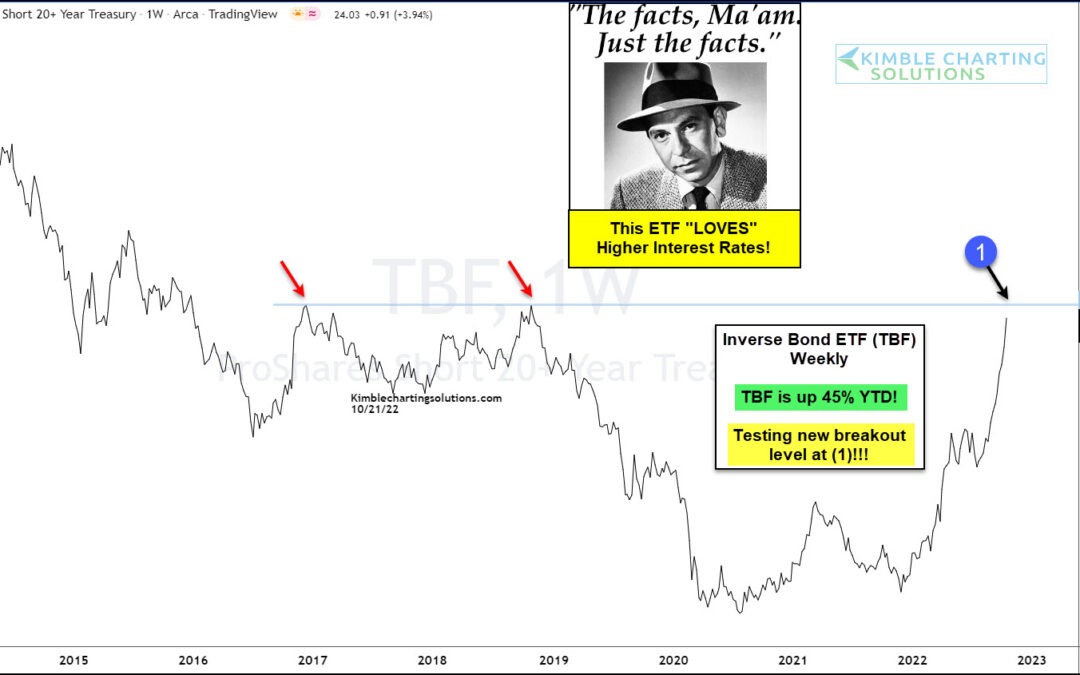
by Chris Kimble | Oct 21, 2022 | Kimble Charting
Rising Interest rates have been very hard on stocks and bonds so far this year. Are any ETF’s doing well during this rapidly rising rate environment? Yup! TBF year to date is up nearly 45%! Joe Friday Just The Fact Ma’am: TBF is screaming higher...
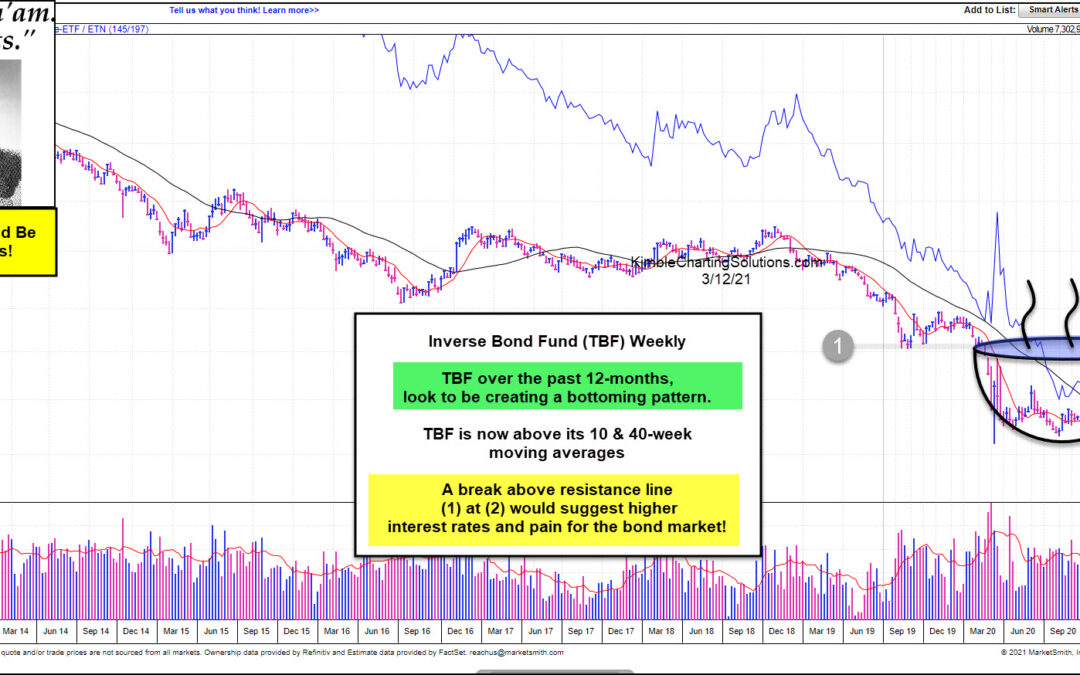
by Chris Kimble | Mar 12, 2021 | Kimble Charting
The bond market has had a bad 12-months, as interest rates bottomed in March of 2020. Popular Government Bond ETF (TLT) has lost more than 15% in the past year! Are bonds about to receive more bad news? Sure could!!! This chart from Marketsmith looks at the Inverse...
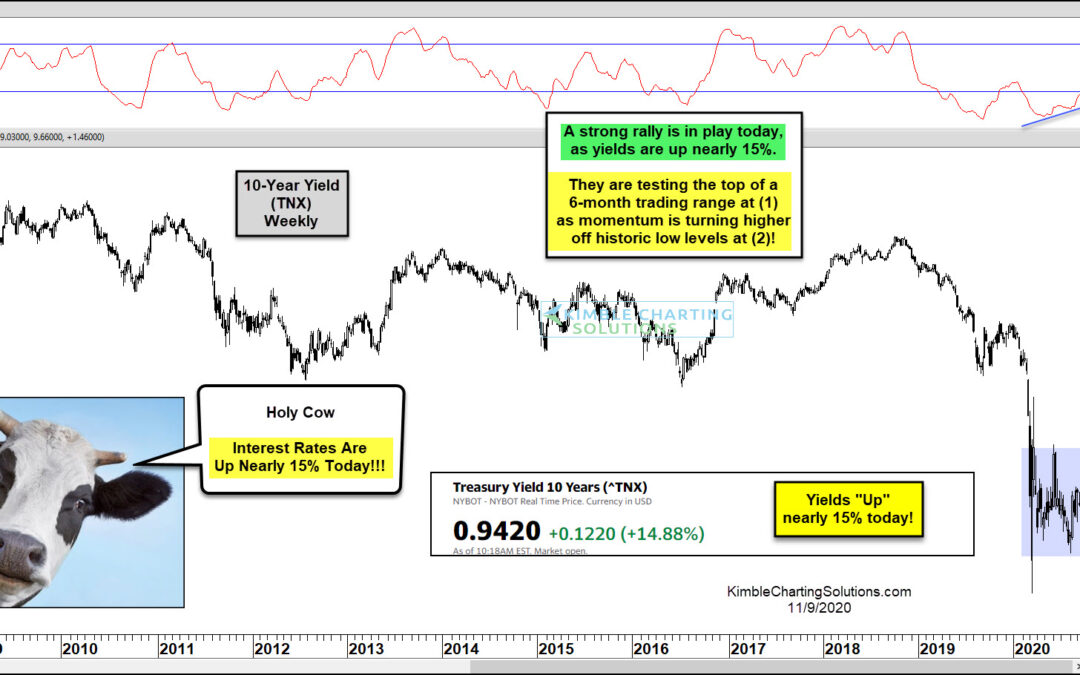
by Chris Kimble | Nov 9, 2020 | Kimble Charting
Holy Cow a big move in interest rates is taking place this morning! Does this mean an important breakout/higher interest rates are about to happen? Could be! This chart looks at the 10-year yield on a weekly basis over the past 12-years. For sure the long-term trend...

by Chris Kimble | Oct 30, 2017 | Kimble Charting
Seems like its easy to hear concerns that inflation is back and that interest rates have to rise. Below looks at the Inflation Indicator (TIP/TLT) and how it is experiencing a key test of resistance at this time. CLICK ON CHART TO ENLARGE The TIP/TLT ratio reflects...
by Chris Kimble | Oct 25, 2017 | Kimble Charting
Interest rates based upon the 10-year yield (TNX) have been heading lower for years, more than 25-years actually. Below looks at the yield on the 10-year note and reflects that an important and rare test is in play. CLICK ON CHART TO ENLARGE Yields on the 10-year note...
