by Chris Kimble | Apr 22, 2024 | Kimble Charting
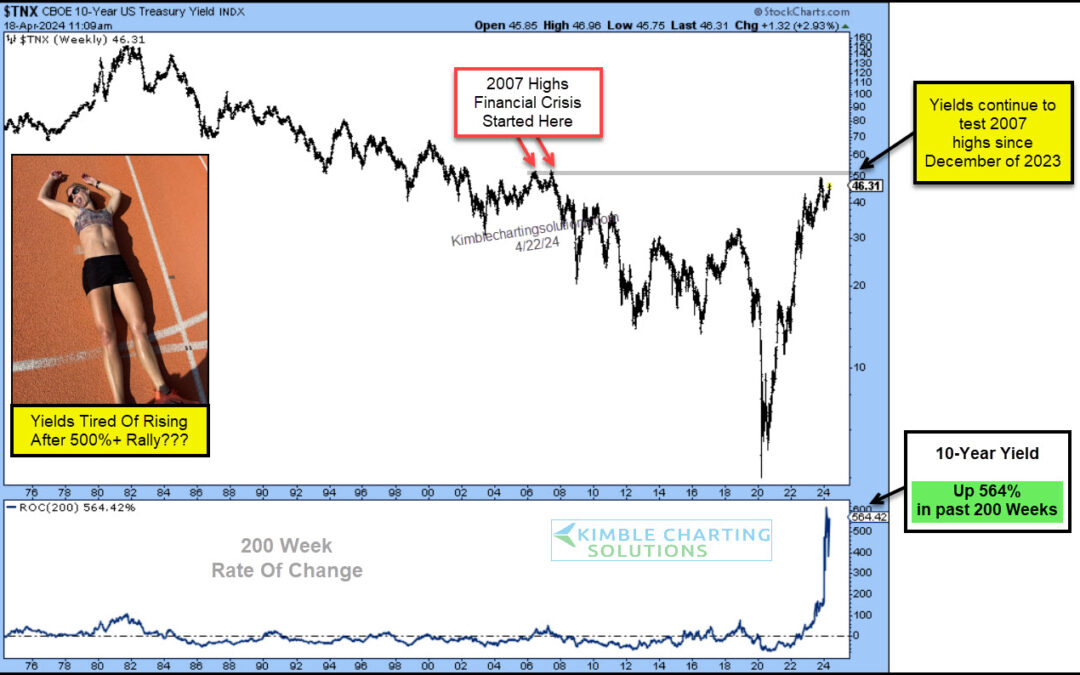
US Treasury bond yields have been moving higher for the past 4 years. Furthermore, the rally marks the largest 200-week rally in 10-year yield history. Wow! So today, we ask, are yields tired after this big run-up? Is it time for a pullback? Today’s chart highlights...
by Chris Kimble | Mar 19, 2024 | Kimble Charting
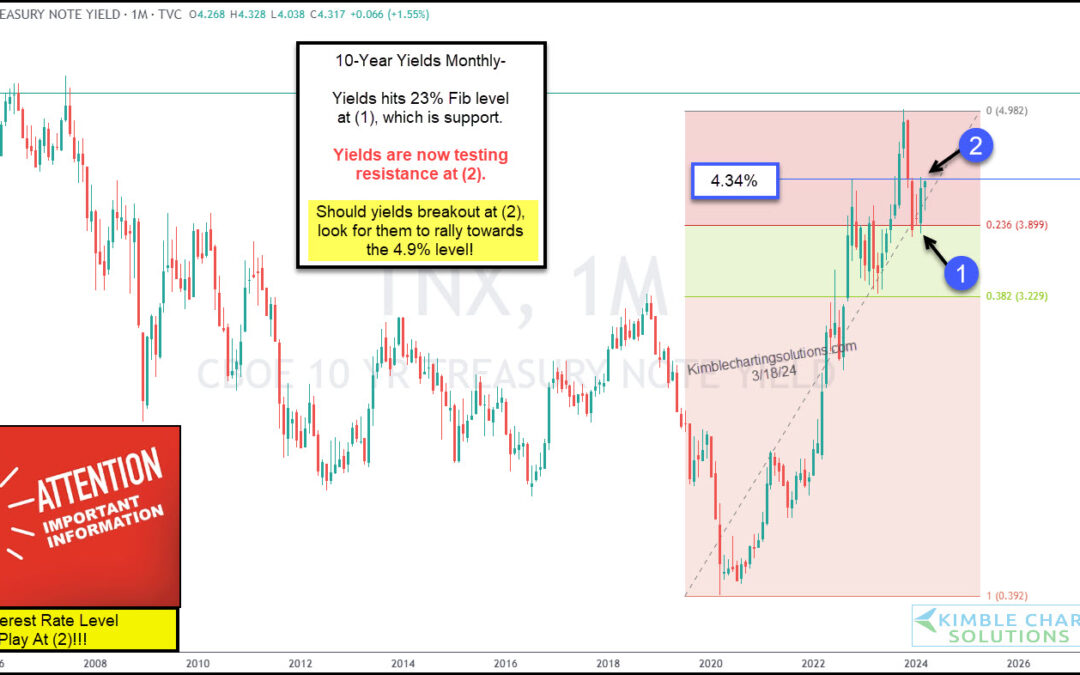
The 10-year treasury bond yield is very closely watched by banks, consumers, and active investors. It is used as a measuring stick for interest rates on loans, bond auctions, etc. When the 10-year treasury bond yield goes higher, so do interest rates on mortgages,...
by Chris Kimble | Aug 21, 2023 | Kimble Charting
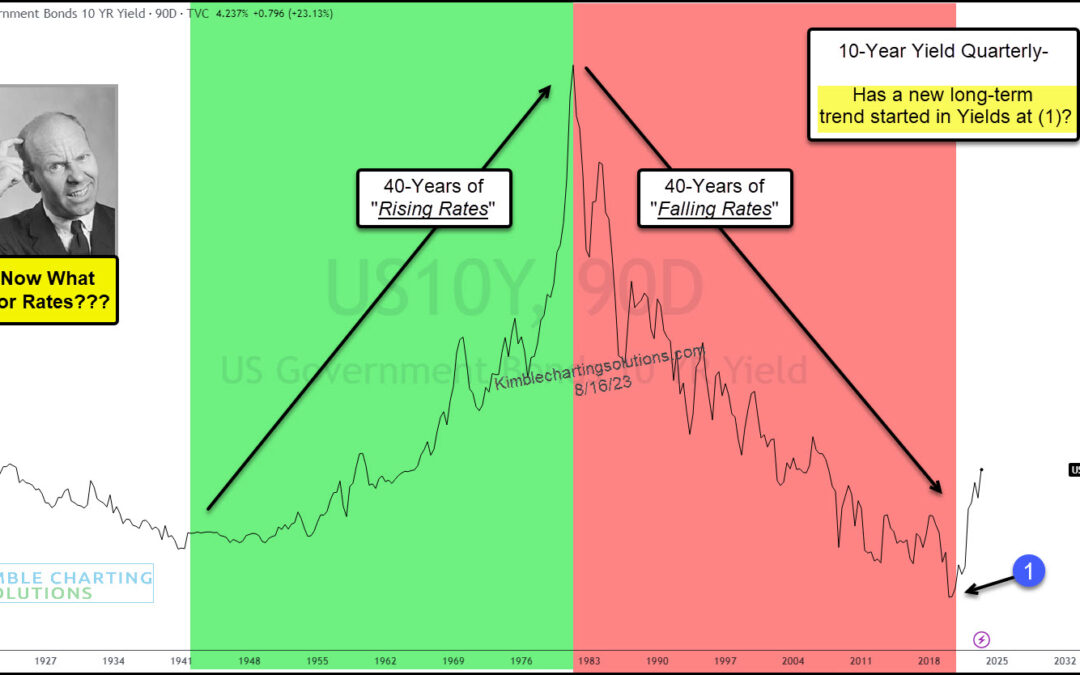
Rising interest rates are beginning to spook investors. And rightfully so. It’s been the fastest rise in rates in decades. And just when we thought interest rates were easing, they pushed higher once more! 40 years up and then 40 years down… now what for bond yields?...
by Chris Kimble | Aug 2, 2023 | Kimble Charting
Interest rates remain in the spotlight with investors watching every economic data release and wondering when the Federal Reserve will stop raising rates. Well, one way to gauge this environment is to watch the 10-Year US Treasury bond yield. And as you guessed, it’s...
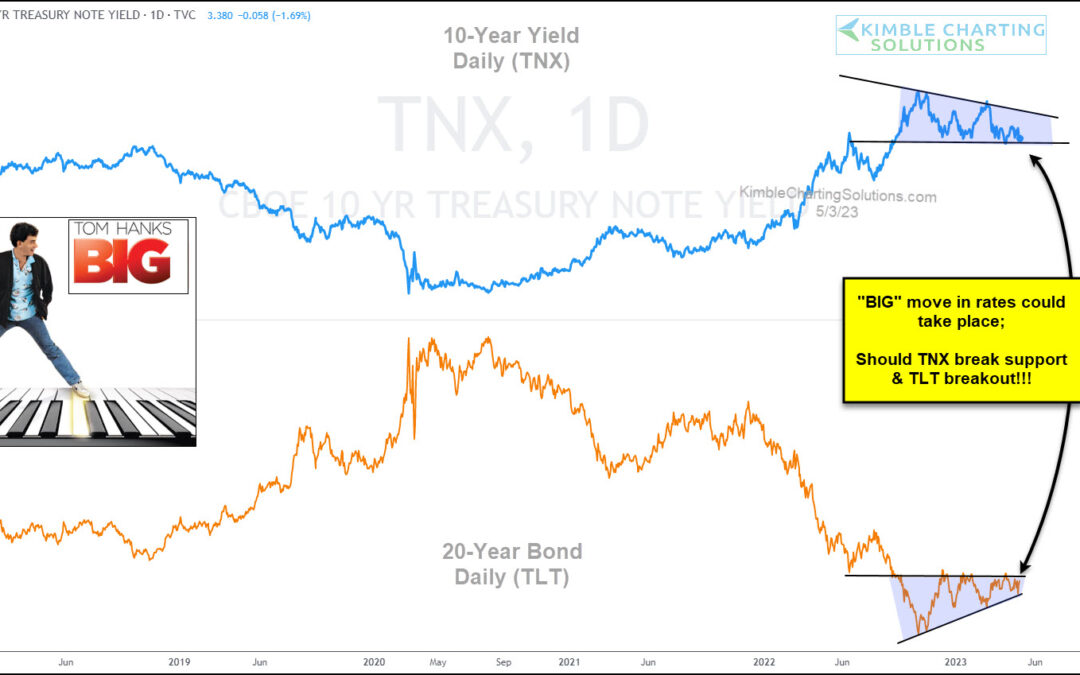
by Chris Kimble | May 5, 2023 | Kimble Charting
As the Federal Reserve continues to fight inflation by raising interest rates, the market is growing uncertain about futures rate hikes. Today, we share a chart comparing the 10-year US treasury bond yield versus the popular 20+ year treasury bond ETF. As you can see,...
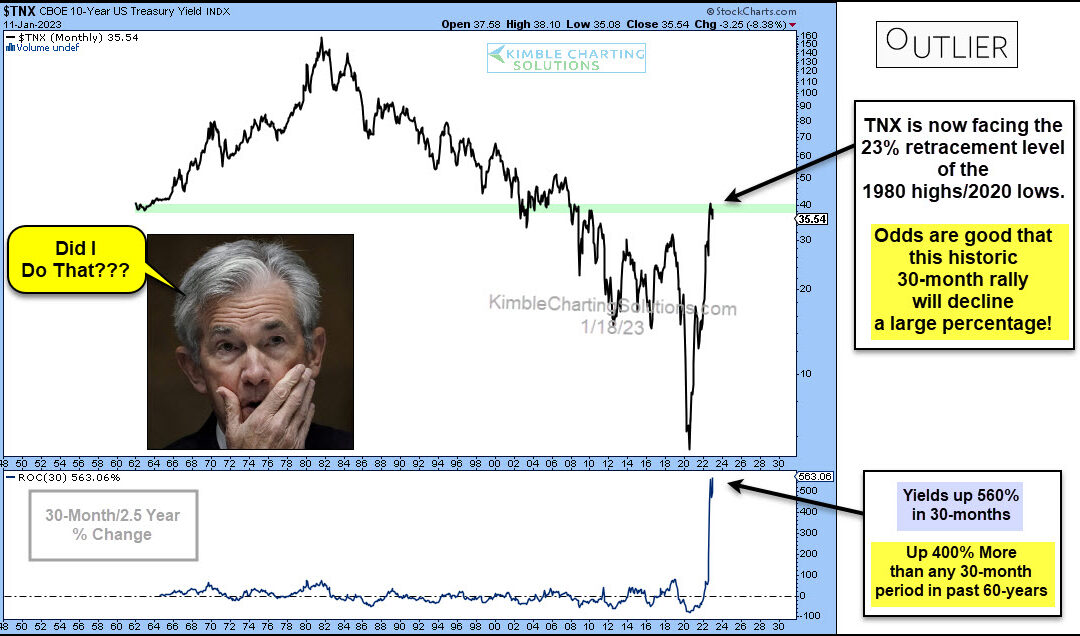
by Chris Kimble | Jan 19, 2023 | Kimble Charting
Interest rates have risen rather quickly as the Federal Reserve attempts to fight inflation. Will the move be a case of too far, too fast? Today’s long-term “monthly” chart of the 10-year US treasury bond yield seems to think so. In my humble opinion, the chart below...
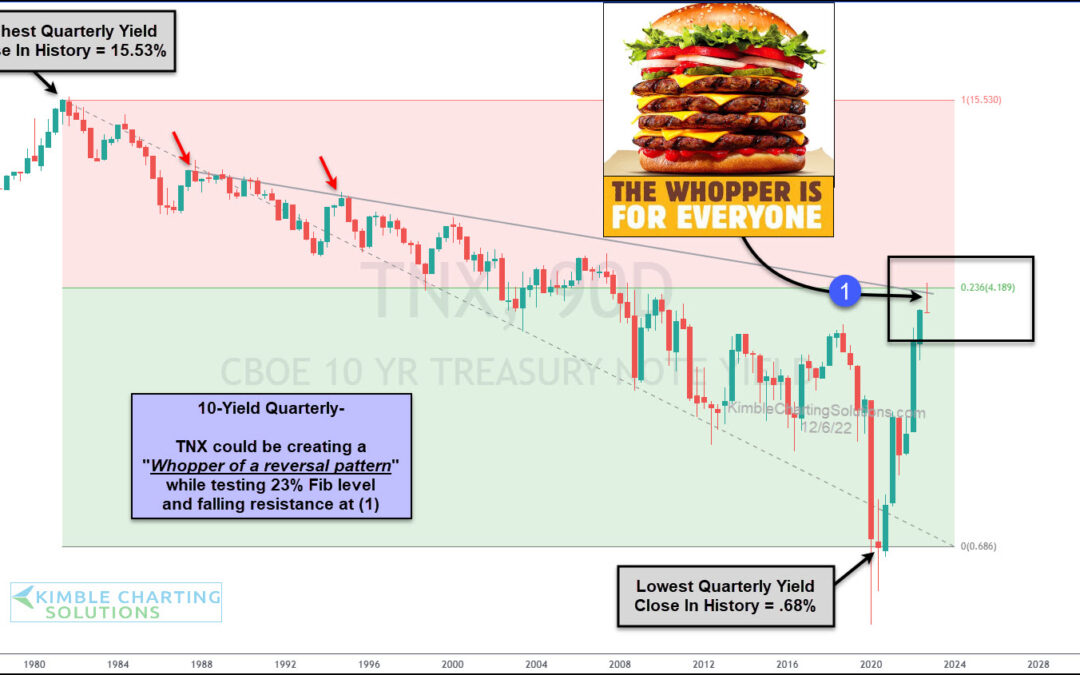
by Chris Kimble | Dec 7, 2022 | Kimble Charting
The past few years have seen extreme volatility in the bond market, which equates to similar volatility in interest rates. And it all started with the onset of coronavirus. The initial panic decline in bond yields (interest rates) was followed by a surge that lasted...
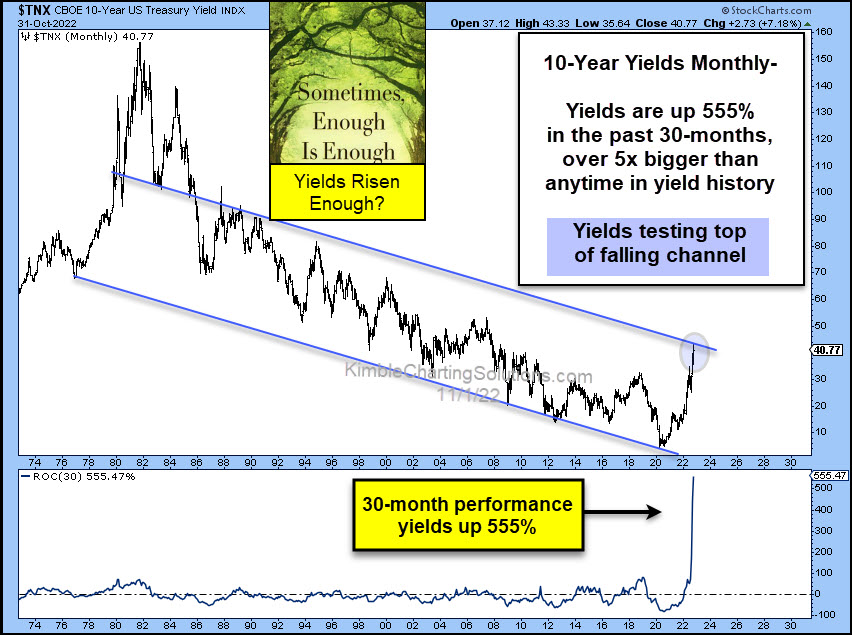
by Chris Kimble | Nov 2, 2022 | Kimble Charting
The rise in interest rates has been meteoric, with mortgage rates reaching levels not seen in nearly 2 decades. The 10-year US treasury bond yield is highly watched as a leading indicator and that yield has risen from near 0 (Covid) to well over 4 percent recently. Is...
