
by Chris Kimble | Feb 1, 2016 | Kimble Charting
CLICK ON CHART TO ENLARGE We all know by now the year got off to a rough start in stock markets around the world. Transports and Russell 2000 are the leaders to the downside over the past 90-days. The declines of late took both of them down to 5-year rising channels,...

by Chris Kimble | Jan 23, 2016 | Kimble Charting
One trend is clear, over the past 90-days, stocks have been soft. Below looks at what markets have been the weakest, during the past 90-days. CLICK ON CHART TO ENLARGE The two “downside leaders” are Transports and Small Caps (Russell 2000). So lets take a...
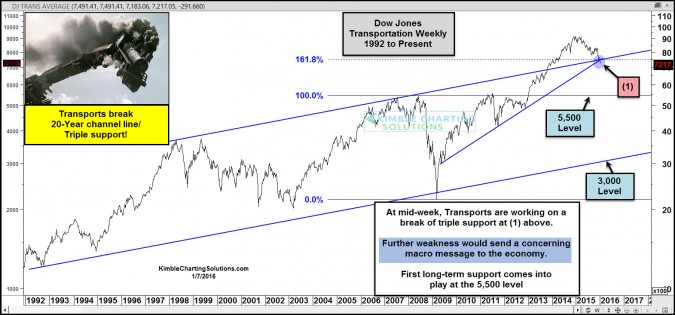
by Chris Kimble | Jan 7, 2016 | Kimble Charting
CLICK ON CHART TO ENLARGE On New Years Eve (before global weakness was taking place), the Power of the Pattern warned investors of a “Slipping Hazard” in the Transport index, as it was near a key breakdown, which could ripple into the broad markets. See...

by Chris Kimble | Dec 31, 2015 | Kimble Charting
CLICK ON CHART TO ENLARGE The Dow Jones Transportation Index has had a rough year, as it is down over 17%, while the S&P 500 is nearly flat for the year. This decline in the Transports, has it testing dual support at (1) above. As mentioned in the chart, support...
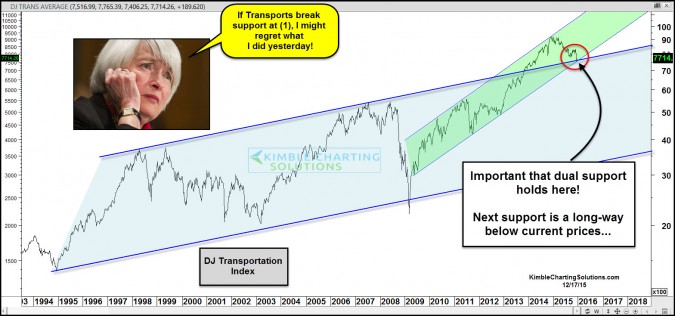
by Chris Kimble | Dec 17, 2015 | Kimble Charting
CLICK ON CHART TO ENLARGE Did the Fed make a mistake by raising rates yesterday? I will leave that answer to people that are much smarter than me. From a Power of the Pattern perspective, what the Transports do at dual support above could say a ton about where the...

by Chris Kimble | Dec 10, 2015 | Kimble Charting
CLICK ON CHART TO ENLARGE The Dow Jones Transportation index since 2009, has remained inside of rising channel (A) above. No doubt, the trend is up! The 6-year rising channel trend is being put to a critical test of support, right now at (1) above. Transports peaked...
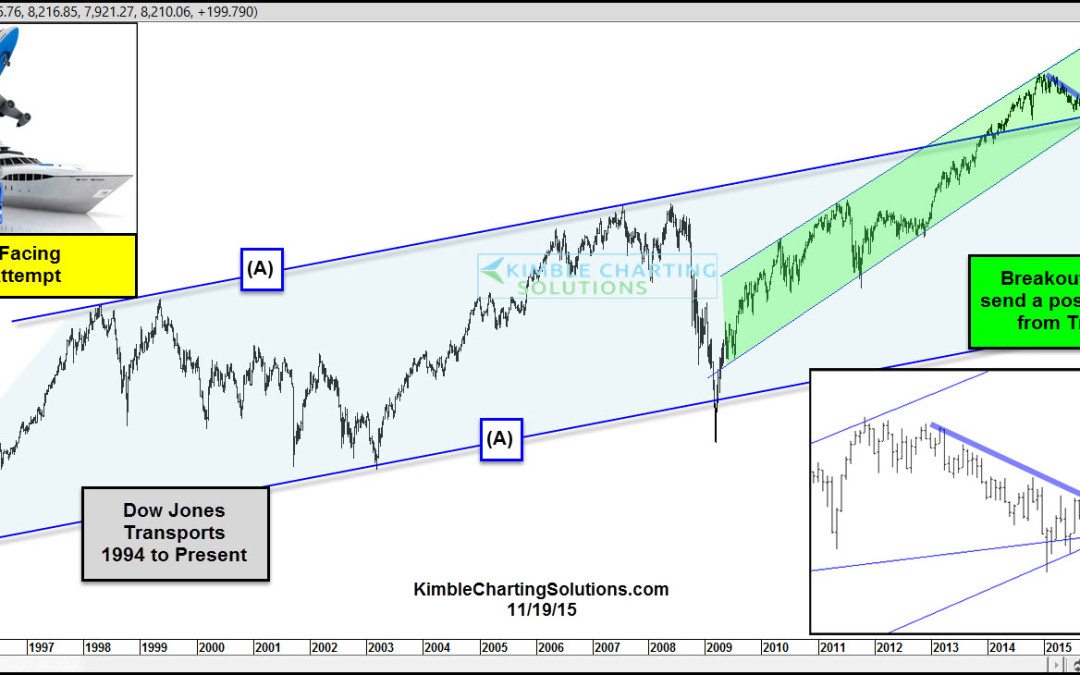
by Chris Kimble | Nov 19, 2015 | Kimble Charting
CLICK ON CHART TO ENLARGE The Dow Jones Transportation index has remained inside of rising channel (A) over the past 20-years. The decline of late took it down to test this channel as support back in August. At the same time it was testing 20-year support, it was...
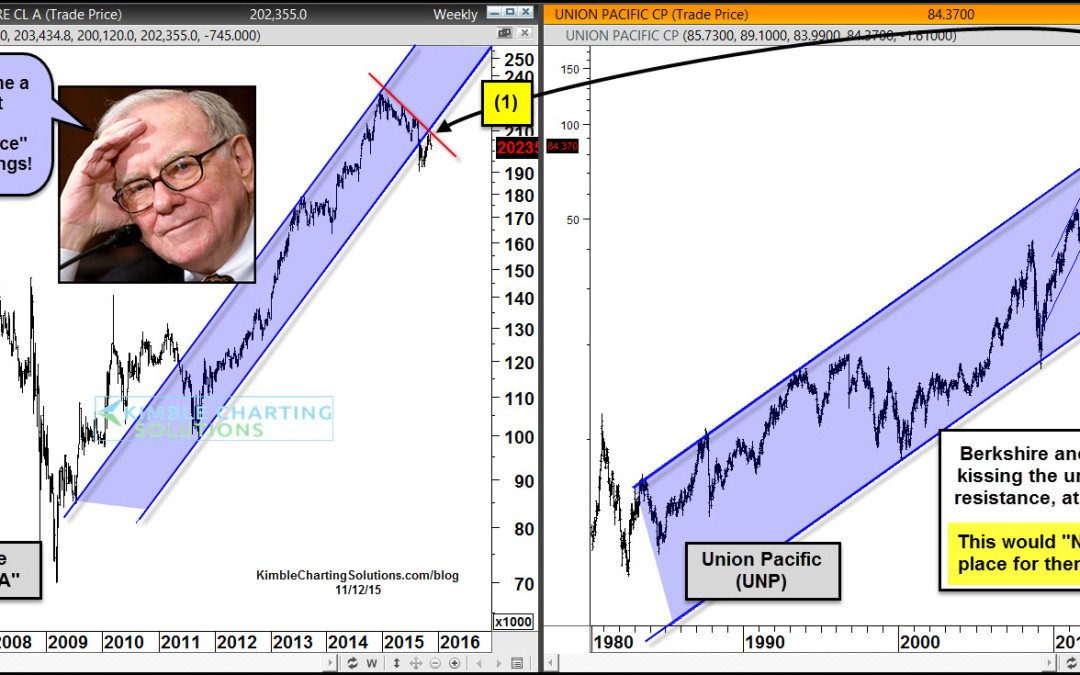
by Chris Kimble | Nov 12, 2015 | Kimble Charting
CLICK HERE TO ENLARGE CHART ABOVE Is Berkshire Hathaway (BRK-A) and Union Pacific (UNP) a good proxy for the broad markets and economy? If you happen to believe they are, what happens to both of them from here, should be very important! BRK and UNP both hit highs...
