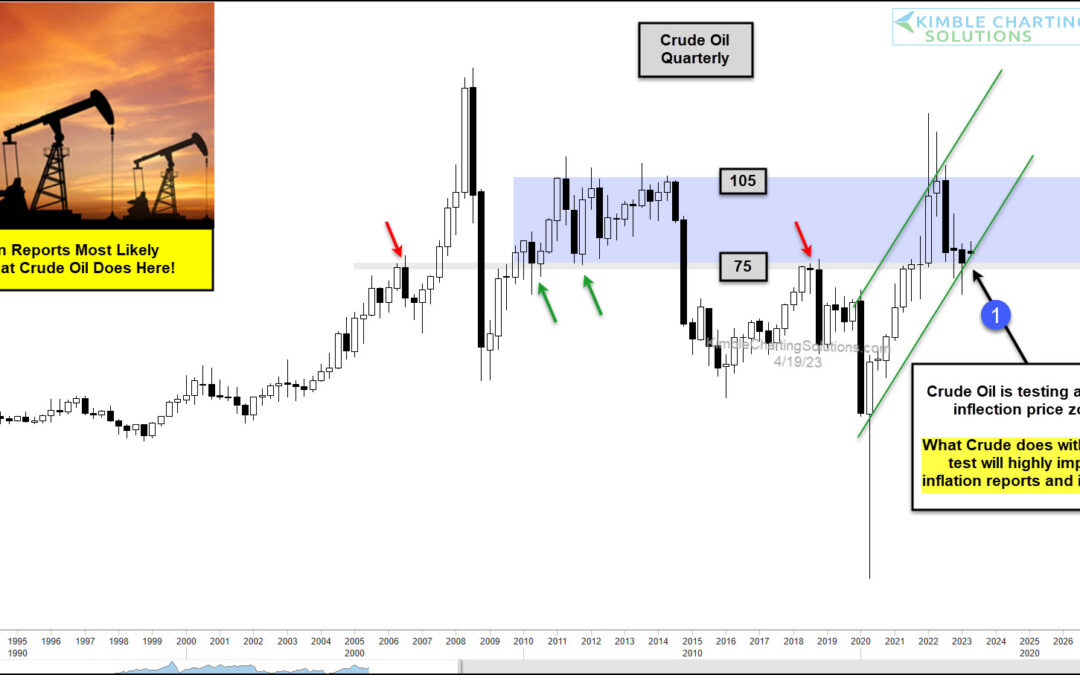
by Chris Kimble | Apr 21, 2023 | Kimble Charting
Inflation concerns peaked last year when agriculture and oil prices peaked. This year has seen inflation fears subside as key price inputs fall. BUT investors should not be complacent. Inflation risks remain. Today, we look at a “quarterly” chart of Crude Oil to...
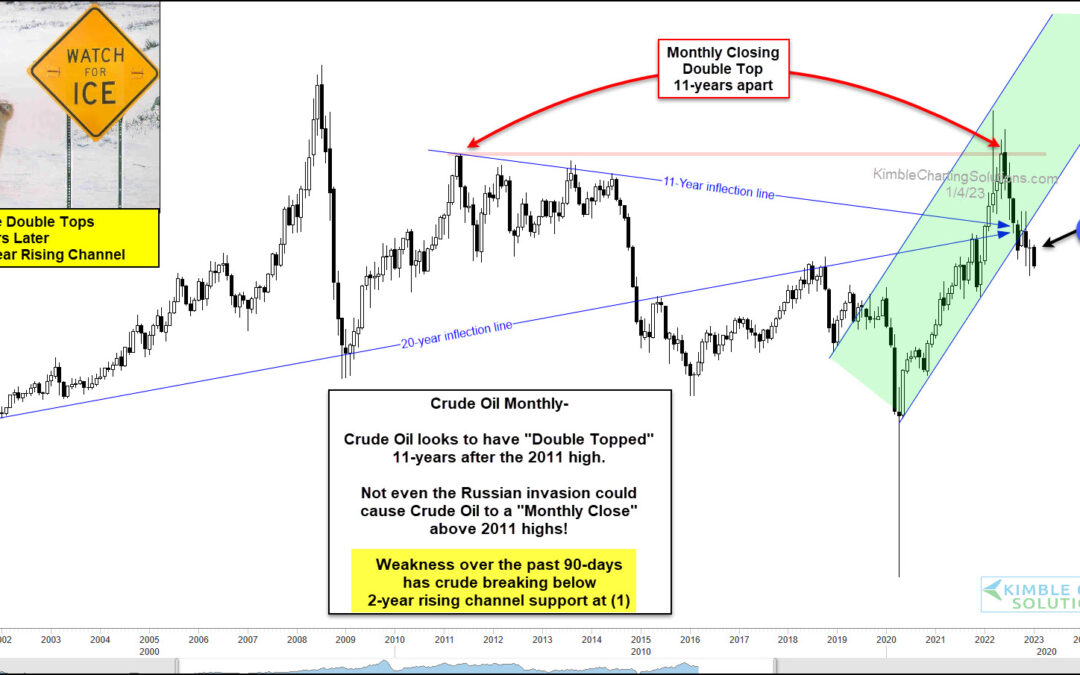
by Chris Kimble | Jan 6, 2023 | Kimble Charting
Oil prices surged on news of the Russian invasion, as investors knew the energy sector would be significantly effected by the war. But for how long? Looking at the “monthly” chart below of crude oil it appears “not for that long”. Note that we highlighted crude oil’s...
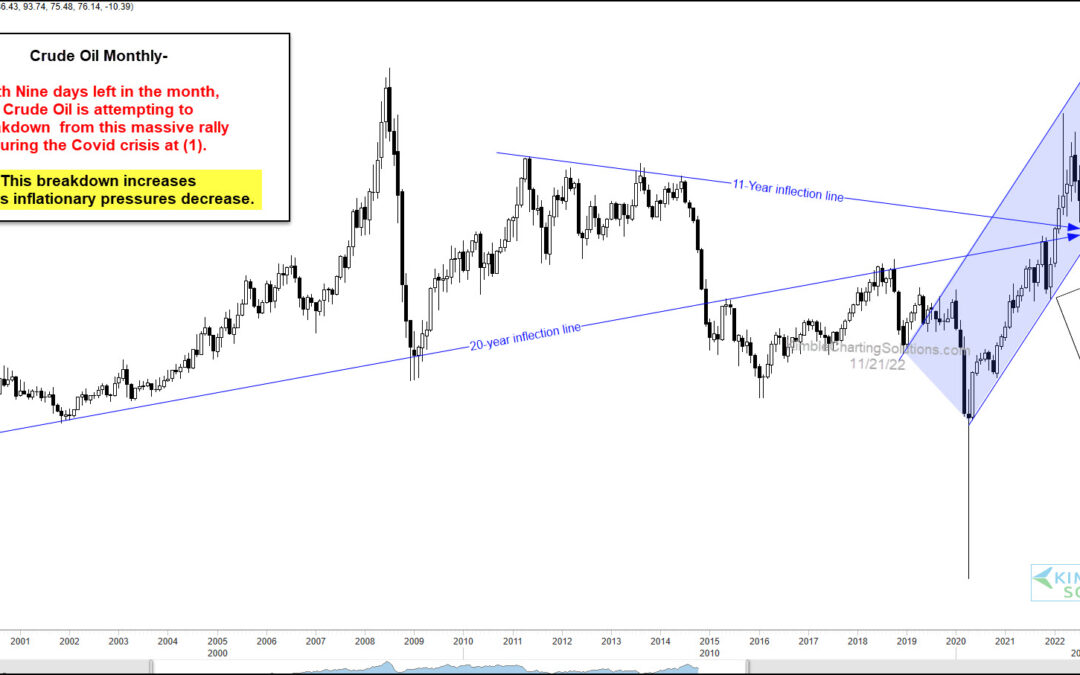
by Chris Kimble | Nov 23, 2022 | Kimble Charting
Crude oil prices rose sharply in 2022 and this has been a major factor in rising consumer prices and inflation. But the past five months have seen oil prices pull back… and this has been welcome news at the gas pump! With the holidays fast approaching, consumers are...
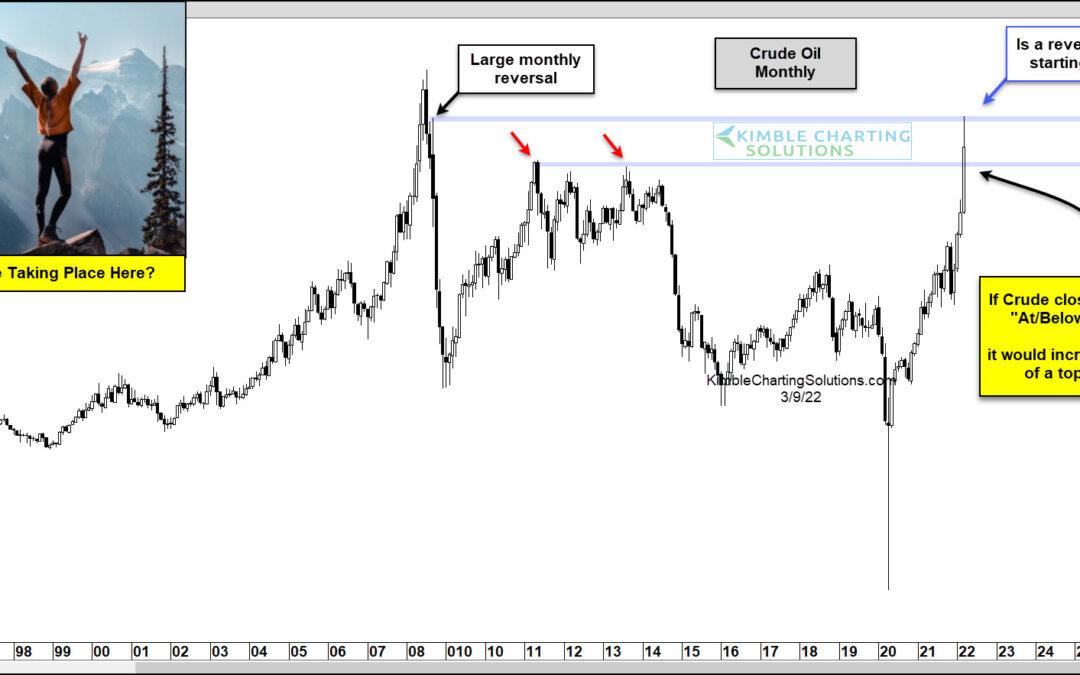
by Chris Kimble | Mar 9, 2022 | Kimble Charting
Crude oil prices (and everything else) started rising with COVID and supply chain issues. And now that we are adding sanctions on Russia and no longer importing Russian oil, the stakes for inflation just went higher. BUT what if this perfect storm created a scenario...
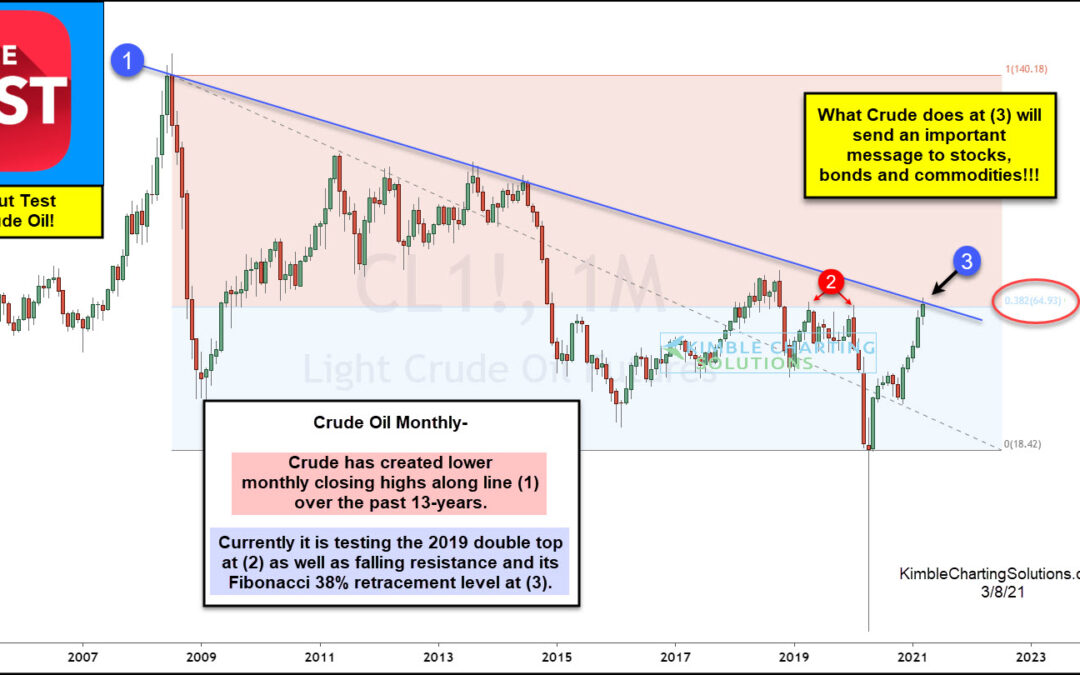
by Chris Kimble | Mar 9, 2021 | Kimble Charting
Commodities prices have rallied sharply higher into 2021, lead recently by energy and grains. Today, we focus in on one universally important commodity: Crude Oil. As you know, Crude Oil is heavily watched due to its importance to the economy, prospects of inflation,...
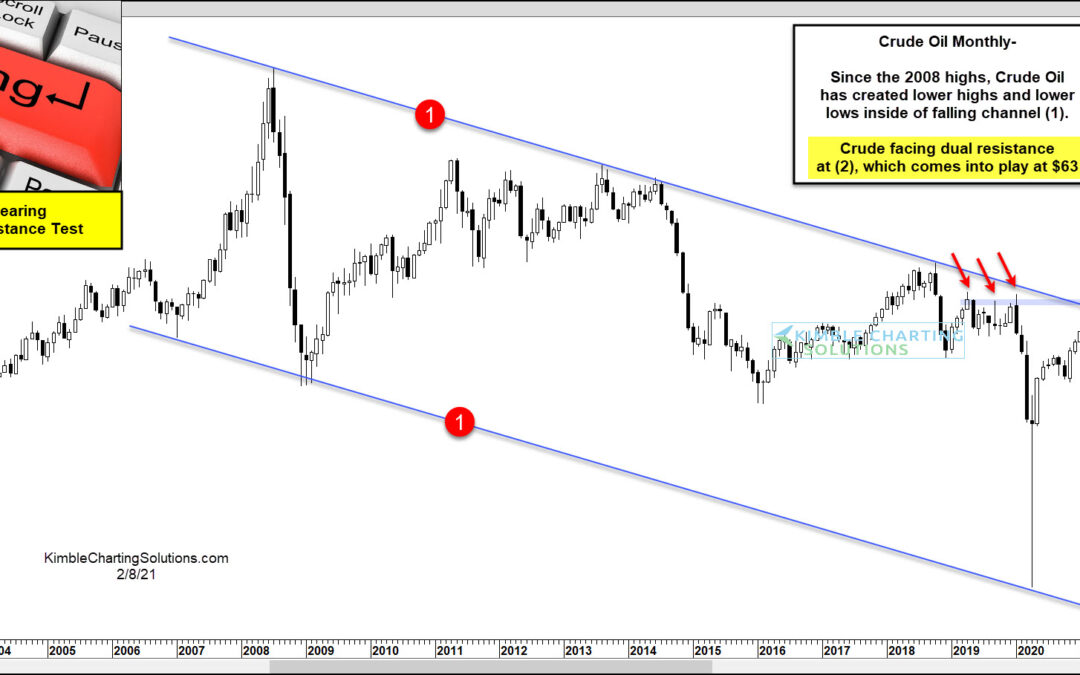
by Chris Kimble | Feb 8, 2021 | Kimble Charting
Key highs and lows in Crude Oil have been important more than once to stocks over the past 20-years. What Crude Oil does in the near future should influence stocks again! Crude oil since its peak back in 2008, has created a series of lower highs and lower lows inside...
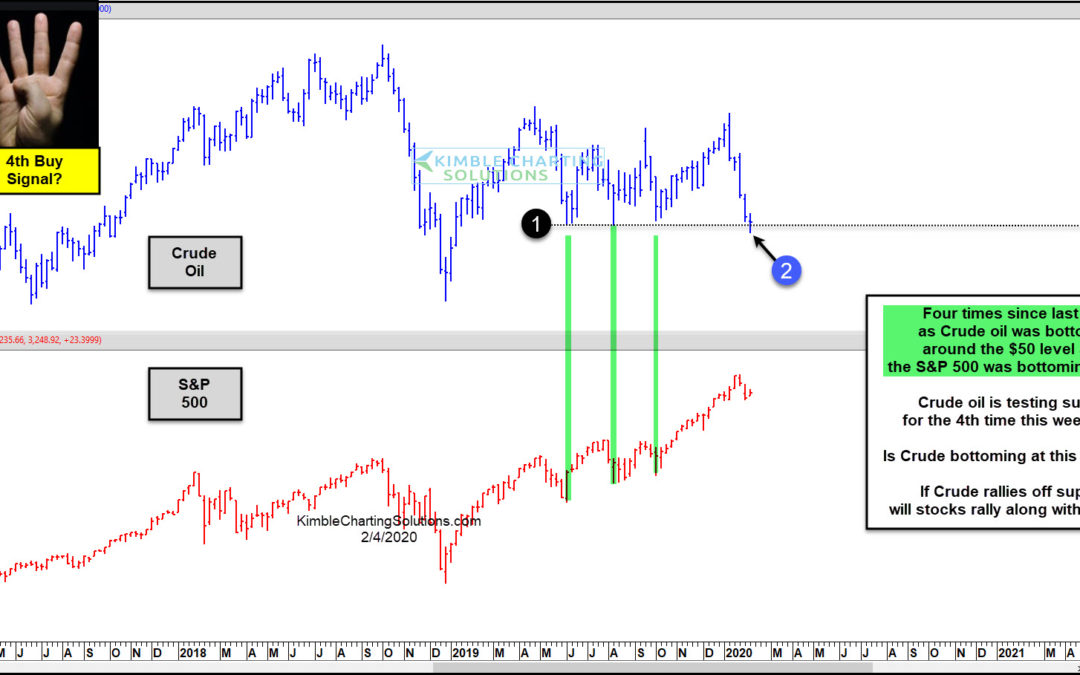
by Chris Kimble | Feb 4, 2020 | Kimble Charting
Is Crude Oil bottoming for the 4th time the last 8-months? Is Crude Oil suggesting that stocks are at a low about to experience a strong rally? Crude Oil has rallied off support line (1), which is the $50 level, three different times since May of 2019. Each time Crude...
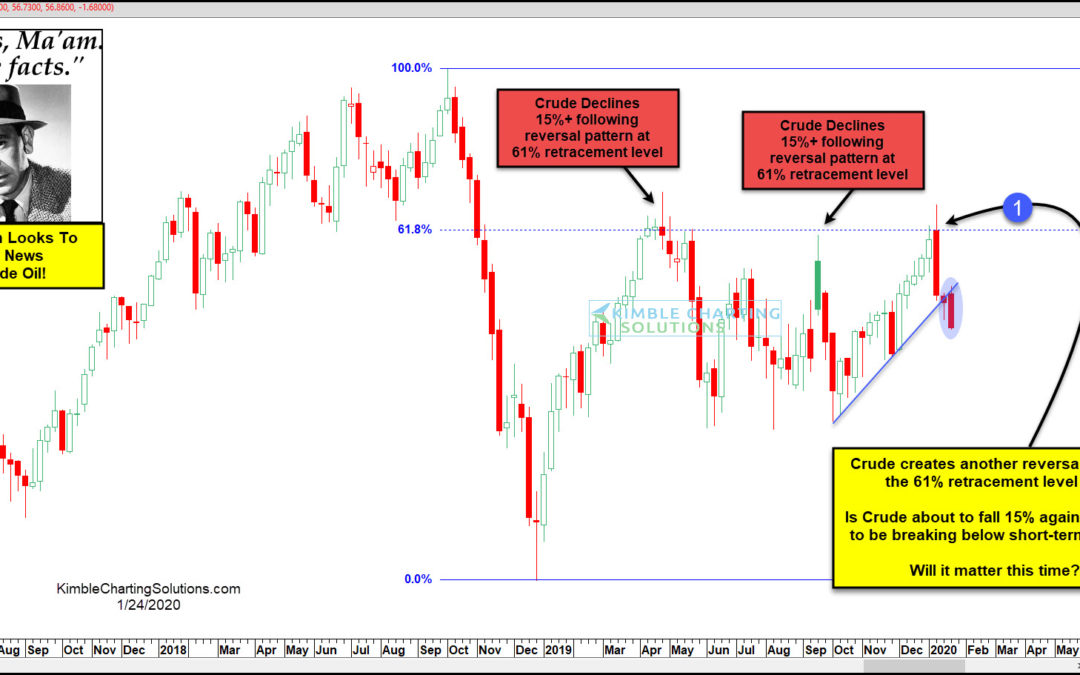
by Chris Kimble | Jan 24, 2020 | Kimble Charting
It’s a good idea for investors to be aware of key indicators and inter-market relationships. Perhaps it’s watching the US Dollar as an indicator for precious metals or emerging markets. Or watching interest rates for the economy. Experience, history, and relationships...
