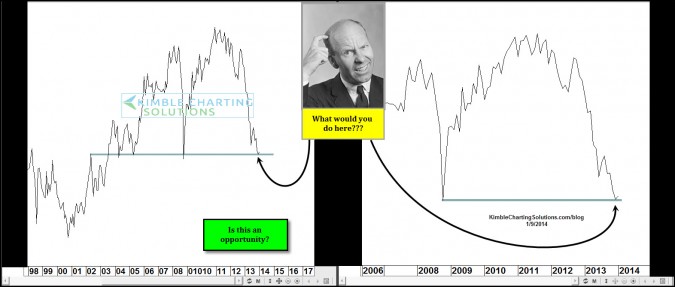
by Chris Kimble | Jan 13, 2014 | Kimble Charting
CLICK ON CHART TO ENLARGE The chart above reflected whats looks to be a Power of the Pattern opportunity at hand, which was shared with members a week ago and was a posted Friday for blog viewers to see. Thank you from the large response from around the world on...

by Chris Kimble | Jan 10, 2014 | Kimble Charting
CLICK ON CHART TO ENLARGE Sent this to members the other day, reflecting what looked like an opportunity not seen in 12-years on the right and 6-years on the right. Without a doubt these assets have been hit hard. What would you do here? Look at it as an...
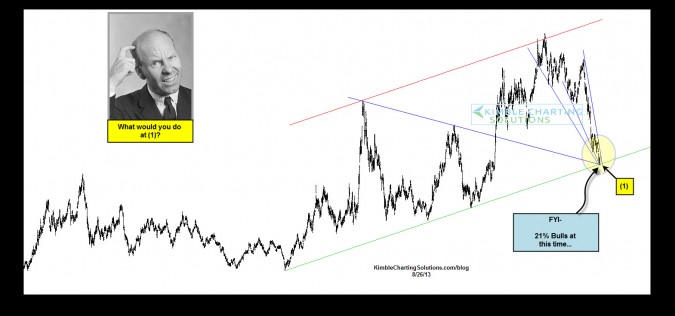
by Chris Kimble | Aug 26, 2013 | Kimble Charting
CLICK ON CHART TO ENLARGE Do you ever have a bias towards a certain asset or financial theme? I do and if most of us are deeply honest to the person in the mirror, we would have to say yes we all are bias from time to time! My strategy is called TB&M (Tops,...
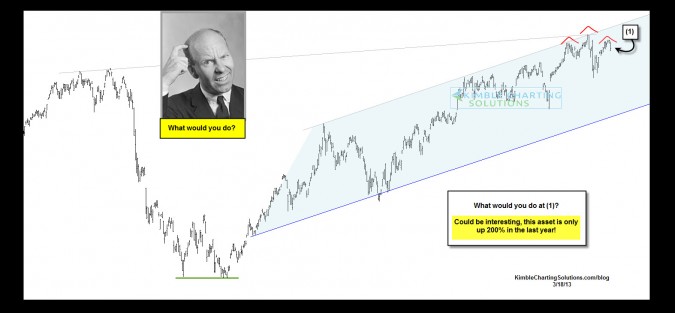
by Chris Kimble | Mar 21, 2013 | Kimble Charting
CLICK ON CHART TO ENLARGE Is one of the “Hottest ETF’s” on the planet creating a “Head & Shoulders” topping pattern? The above chart was the quiz from 3 days ago. This chart reflects a potential “Head & Shoulders”...

by Chris Kimble | Mar 18, 2013 | Kimble Charting
CLICK ON CHART TO ENLARGE What would you do with the opportunity/pattern? I will post the answer on the blog Thursday. If you would like to share your thoughts on the pattern, opinion on what you would do with this asset or would like the answer to...

by Chris Kimble | Jan 23, 2013 | Kimble Charting
On 1/15, the chart below was shared with Premium Members, reflecting what looked to be an a good opportunity/chart pattern. This asset found itself near channel support and was creating a series of higher lows after a large decline. CLICK ON CHART TO ENLARGE The...

by Chris Kimble | Jan 18, 2013 | Kimble Charting
CLICK ON CHART TO ENLARGE I shared this chart with Premium members a few days ago. It reflects an asset that has… declined 90% in value, was hitting rising support, created a bullish falling wedge and is nearing a breakout. What would you do with this...
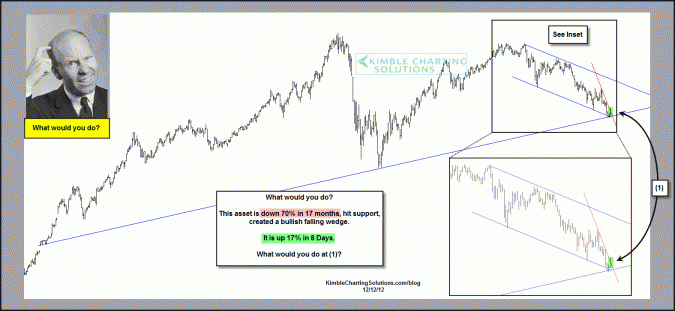
by Chris Kimble | Dec 31, 2012 | Kimble Charting
This chart below was sent to Premium members on 12/12, reflecting a key pattern opportunity looked to be at hand and then was posted on the blog as a quiz (see quiz post here) CLICK ON CHART TO ENLARGE This asset looked to be an opportunity because it was…. on...
