
by Chris Kimble | Oct 29, 2013 | Kimble Charting
CLICK ON CHART TO ENLARGE Junk bond mutual funds and ETF’s started reflecting weakness back in May, about the time the S&P 500 was starting to struggle a little bit. The decline in the junk market saw each of these 6 funds/ETF’s highlighted above, to...

by Chris Kimble | Aug 23, 2013 | Kimble Charting
CLICK ON CHART TO ENLARGE Whether you own them or not, I believe it is important to keep one eye on the two broadest index’s, the NYSE Composite and Wilshire 5000. Let me make this clear…the trend on both remains up at this time! Both are facing multi-year...

by Chris Kimble | Jul 19, 2013 | Kimble Charting
CLICK ON CHART TO ENLARGE The Wilshire 5000, the broadest of all U.S. Stock index’s broke above a 13-year resistance line and retested the old resistance line as support and is pushing higher. At the same time the NYSE Advance/Decline line is near all-time high...
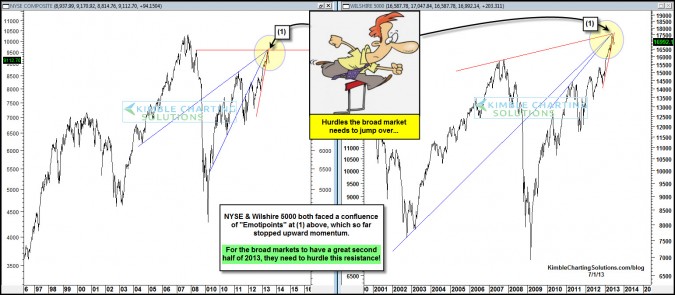
by Chris Kimble | Jul 1, 2013 | Kimble Charting
CLICK ON CHART TO ENLARGE Well the first half of 2013 is behind us and the S&P 500 had a great first half, gaining over 12%. Two of the broadest index’s that had a good first half as well, ran into an confluence of Emotipoints dating back several...

by Chris Kimble | Jun 18, 2013 | Kimble Charting
CLICK ON CHART TO ENLARGE Two of the U.S. broadest index’s (NYSE Composite & Wilshire 5000) are both facing a series of resistance lines that so far stopped them on a dime towards the end of May. Could the confluence of resistance lines at this time become...

by Chris Kimble | May 14, 2013 | Kimble Charting
CLICK ON CHART TO ENLARGE While the world often keeps its eye on the S&P 500, the Wilshire 5000 is a much broader index, reflecting a story of how large and small cap stocks are doing. The Wilshire 5000 faced two resistance lines recently, created off several key...

by Chris Kimble | Apr 23, 2013 | Kimble Charting
CLICK ON CHART TO ENLARGE Barron’s has conducted its “Big Money” poll since the 1990’s. Last fall when the stock markets weren’t doing really well, this poll came in with one of the lower readings that has taken place in the past...

by Chris Kimble | Apr 17, 2013 | Kimble Charting
CLICK ON CHART TO ENLARGE The Wilshire 5000 is the broadest U.S. stock index, a quality measure of large, medium and small caps all wrapped up into one big bundle. The great Johnny Carson used to play Carnac the magnificent , making accurate predictions was he...
