by Chris Kimble | Mar 4, 2020 | Kimble Charting
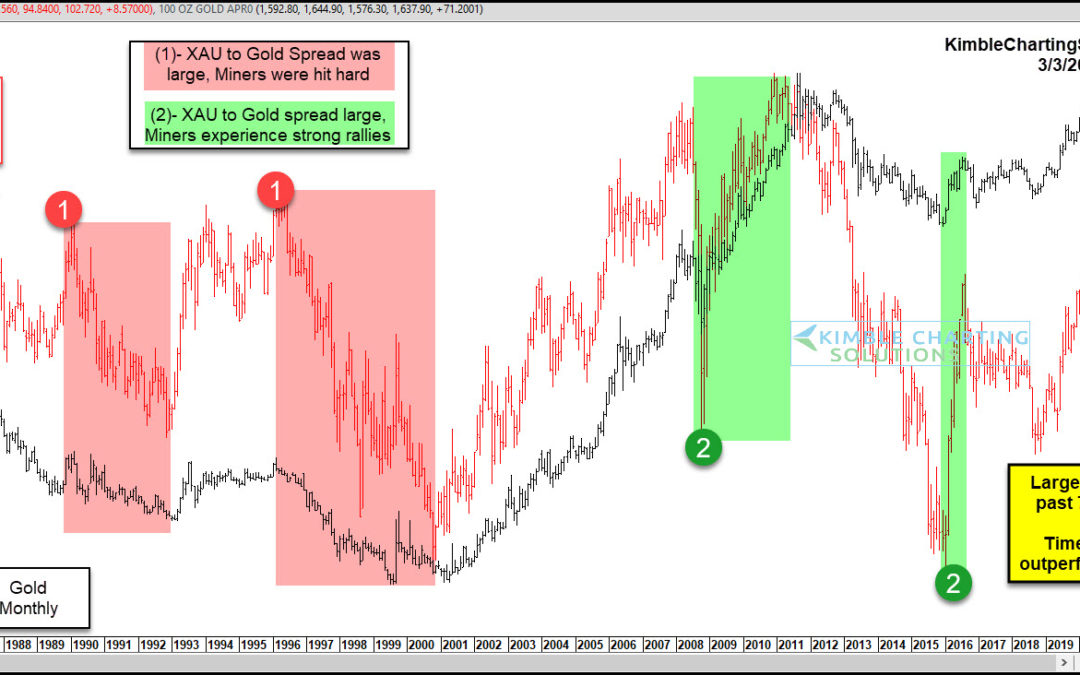
I like to look at price spreads, particularly spreads between related assets. When they become too wide, they point to a strong potential for mean reversion (and an opportunity for investors). Today, we look at the spread between the Gold/Silver Miners Index (XAU) and...

by Chris Kimble | Jul 5, 2016 | Kimble Charting
The chart below looks at the Gold & Silver mining index, dating back to to the early 1980’s. The Index lost over 80% of its value from 2011 to the 2016 lows, where it looks to have created a double bottom (2000 lows). CLICK ON CHART TO ENLARGE The index has...

by Chris Kimble | May 23, 2016 | Kimble Charting
CLICK ON CHART TO ENLARGE The XAU Index is the oldest Gold & Silver mining index in the states, as it started keeping track of Gold & Silver mining stocks in the early 1980’s. With this index having such a long history, it allows any of us to do pattern...
by Chris Kimble | Mar 6, 2014 | Kimble Charting
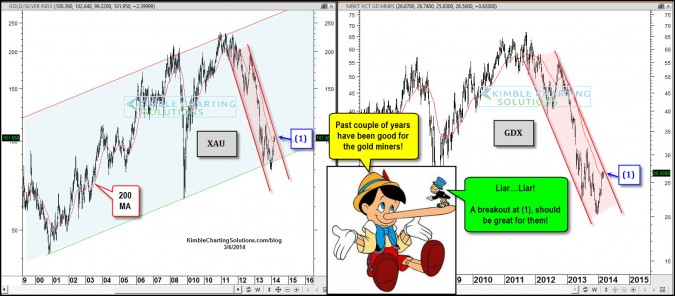
CLICK ON CHART TO ENLARGE Its been a great couple of years for the gold miners! Well we all know that’s not the truth. It has been a great couple of months for them though, as $GDX is up 25% YTD. I shared with members the first of the year...
by Chris Kimble | Oct 14, 2013 | Kimble Charting
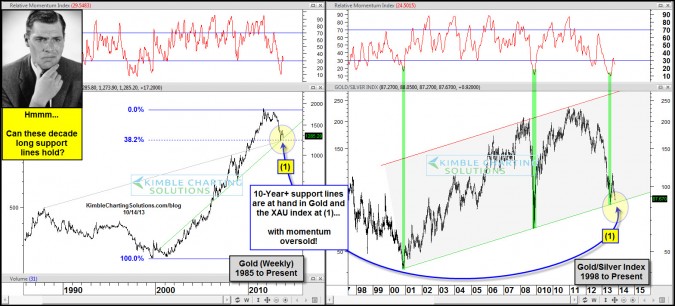
CLICK ON CHART TO ENLARGE Its been a rough two years for Gold and the Gold/Silver Miners index (XAU), to say the least. Two years ago $GLD not only became the largest “sector” ETF in the world, it also became the largest ETF period! Since the crowded...
