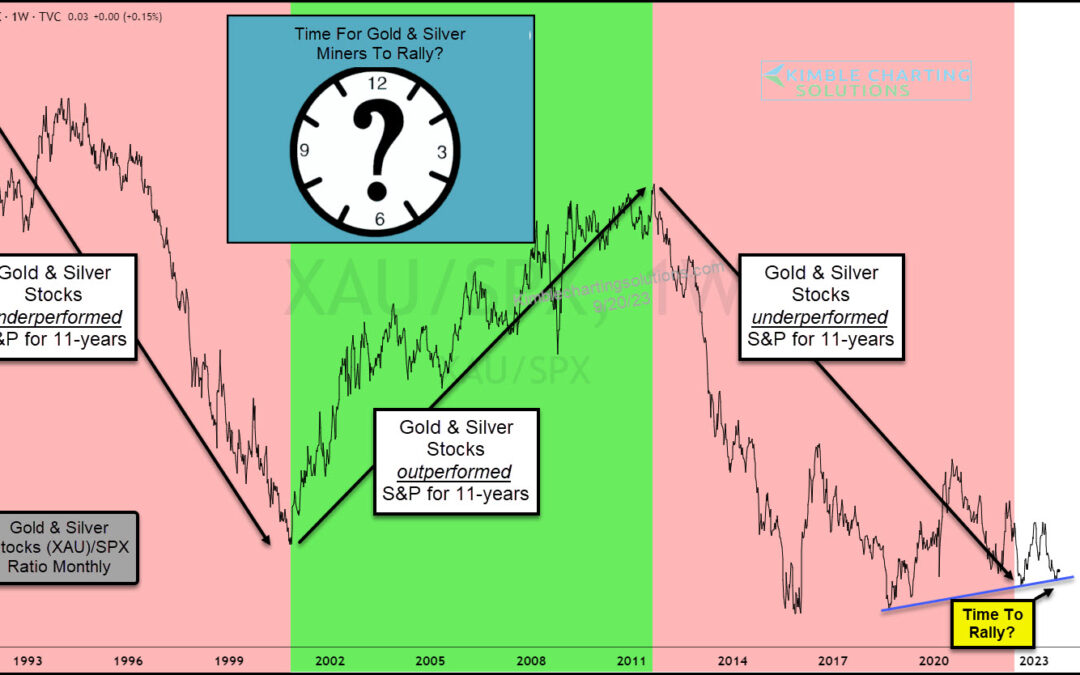
by Chris Kimble | Sep 20, 2023 | Kimble Charting
The price of gold is trading just off its all-time highs while the price of silver is lagging. Together, they haven’t quite provided mining equities the boost they need to out-perform the broad market. But an 11-year cycle may be saying that gold and silver mining...
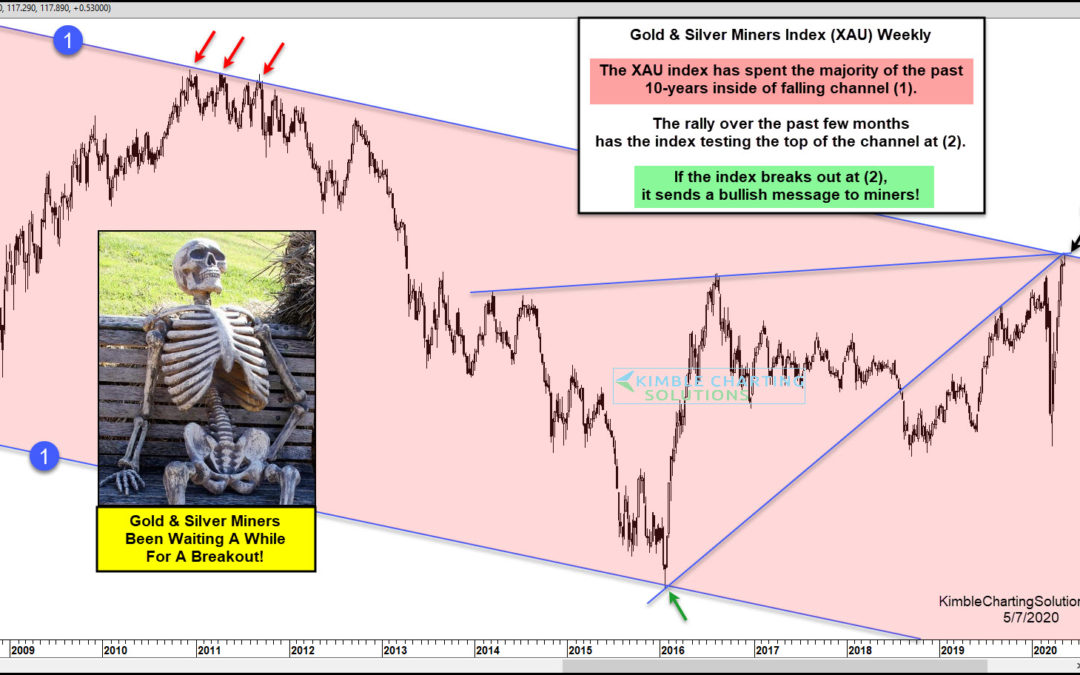
by Chris Kimble | May 7, 2020 | Kimble Charting
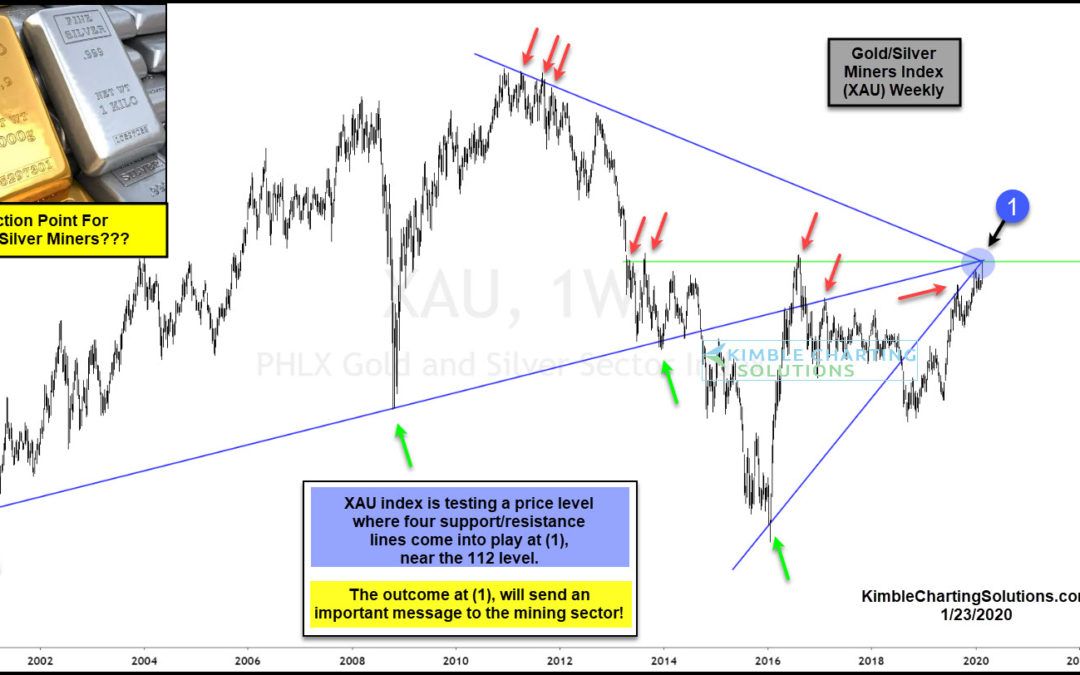
Are Gold & Silver Miners about to send a bullish message for the first time in 10-Years? We will see soon! The Gold & Silver Miners Index (XAU) has created a series of lower highs and lower lows inside of falling channel (1) over the past decade-plus. The...
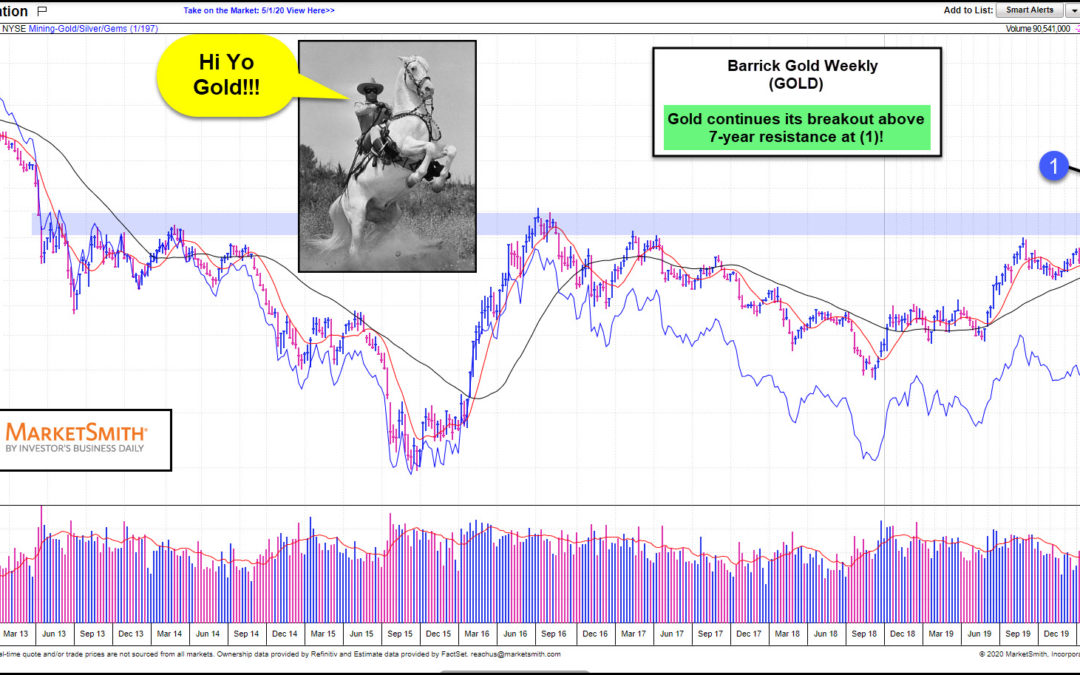
by Chris Kimble | May 2, 2020 | Kimble Charting
Is it “Hi-Yo Gold” time? At least in the short-term, it is! This chart looks at Barrick Gold Corp (GOLD) on a weekly basis. Gold has struggled to break above the blue shaded resistance zone for years, which comes into play just below the $23 level. This...
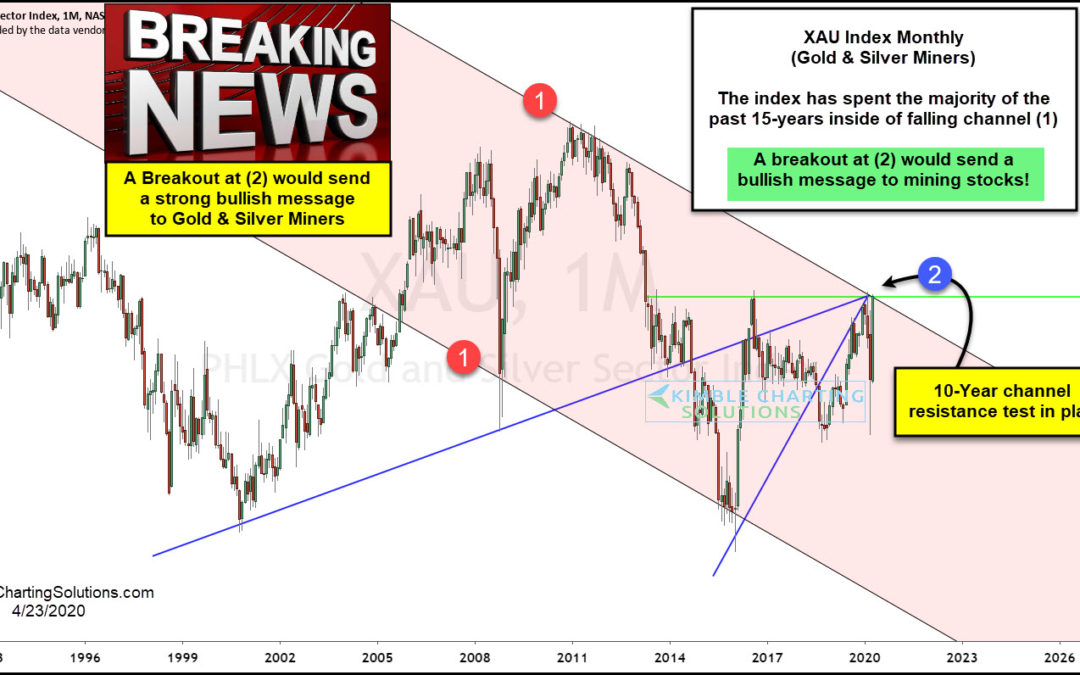
by Chris Kimble | Apr 24, 2020 | Kimble Charting
It’s been an interesting year for precious metals investors. While Gold has been the shining star this year, clocking gains of 14% (through April 23), Silver is down 14%. But gold’s big gains have captured headline attention and spurred bullish sentiment. And this has...
by Chris Kimble | Feb 24, 2020 | Kimble Charting
Gold / Silver Miners Index (XAU) Chart (Oldest Mining Index, which combines Gold & Silver Mining Stocks) The rally in precious metals has been impressive. Gold is up over 9 percent in 2020 and over 35 percent in the past 18 months. Silver is up nearly 4 percent in...
by Chris Kimble | Oct 23, 2018 | Kimble Charting
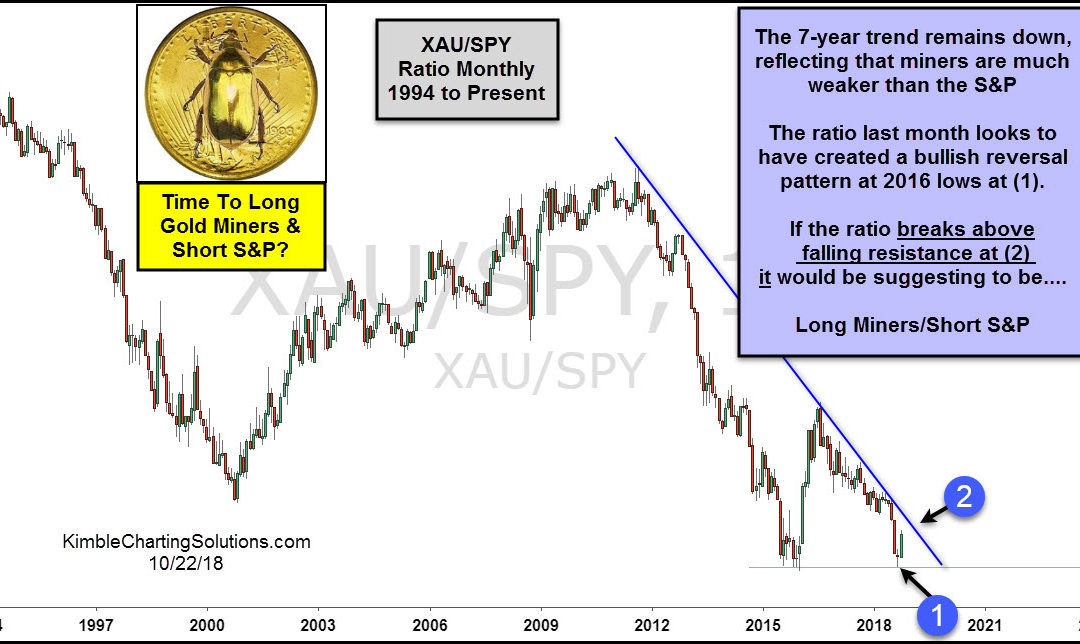
The precious metals sector continues to be a “grind”, offering a few trades but mostly sideways to lower action. Gold prices have slogged along and this had held the Gold Miners (NYSEARCA:GDX) back… until recently. The Gold Miners (GDX) and the broader Gold &...
by Chris Kimble | Mar 13, 2017 | Kimble Charting
Gold & Silver Mining stocks have had a rough few weeks, falling in excess of 15%, after a sharp post Christmas rally. Are they in trouble or about to bounce of newly created rising channel support? Below looks at the Gold Bugs Index (HUI) over the past few years....
