by Chris Kimble | Jun 20, 2018 | Kimble Charting
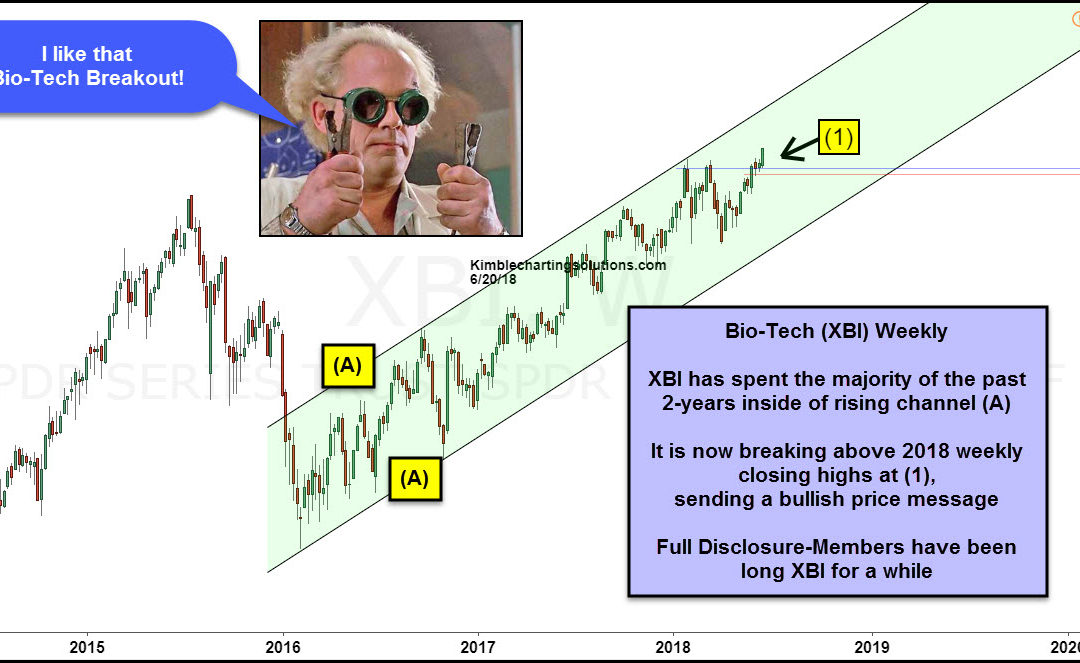
CLICK ON CHART TO ENLARGE The chart above looks at Bio-Tech ETF (XBI) over the past 3-years. It has spent the majority of the past couple of years inside of rising channel (A), reflecting that its trend remains up. It created a series of horizontal highs over the past...

by Chris Kimble | Jun 21, 2017 | Kimble Charting
Bio-tech used to be an upside leader over the broad market coming off the 2009 lows. Bio-tech gave up its leadership back in 2015, where it peaked and started under performing the broad market. Over the past 15-months, Biotech has started acting a little better. Below...

by Chris Kimble | Mar 1, 2017 | Kimble Charting
When looking back 5-years, what sector has double the performance of the S&P 500? How is this sector doing of late? Below looks at the Bio-Tech ETF XBI since 2012. The chart reflects that over the past 5-years the S&P had done very well, as it is up 70%. Over...
