by Chris Kimble | Sep 8, 2014 | Kimble Charting
CLICK ON CHART TO ENLARGE Three years ago last week, I shared a chart highlighting why Gold may underperform for years to come. The chart looked at the correlation between the Swiss Franc and Gold and how both were tagging ascending long-term resistance at the...

by Chris Kimble | Jan 17, 2014 | Kimble Charting
CLICK ON CHART TO ENLARGE What a difference 30-months can make! 30-Months ago the Power of the Pattern shared that Gold could be flat to down for years to come (see post here) Its not been too pretty for metals since that time frame, as Gold has lost one...

by Chris Kimble | Sep 12, 2013 | Kimble Charting
CLICK ON CHART TO ENLARGE The above chart was produced two years ago this month, when Gold was trading just under $1,900 per ounce. The pattern suggested Gold would trade flat to down for years to come (see post here) Since this posting, Gold has declined almost...

by Chris Kimble | Jun 26, 2013 | Kimble Charting
CLICK ON CHART TO ENLARGE Almost two years ago the Power of the Pattern shared that Gold looked to be forming a Bearish Eiffel Tower pattern (see Gold Eiffel here) and that the Swiss Franc was suggesting Gold will be flat to down for years to come (see Franc...

by Chris Kimble | Apr 2, 2013 | Kimble Charting
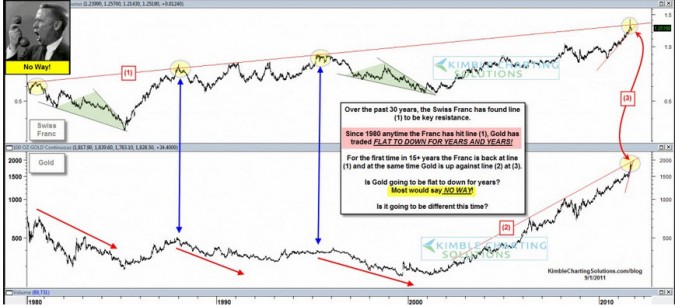
The Power of the Pattern suggested on 9/1/2011, when gold was trading at $1,828, that Gold could trade flat to down for years to come! (see 9/2011 post here) CLICK ON CHART TO ENLARGE The top chart reflected that for 30-years, each time the Swiss Franc hit resistance...

by Chris Kimble | Dec 8, 2011 | Kimble Charting
The “Power of the Pattern” suggested in the chart below that an Eiffel tower pattern in Gold could be taking place on 8/23. The chart below was created “the morning that Gold hit its high so far this year.” (see post here) The concern of...

by Chris Kimble | Sep 26, 2011 | Kimble Charting
On 9/1 I shared the chart below, reflecting that the Swiss Franc was up against a resistance line that had held each time over the past 30 years and that Gold was at the top of a 10 year rising channel. I also discussed that if the “Power of the...

by Chris Kimble | Sep 22, 2011 | Kimble Charting
CLICK ON CHART TO ENLARGE Shared a few days ago that SLV had created a flag/pennant pattern, suggesting a huge move should take place in SLV and the key hint on direction was that On-Balance-Volume (OBV) was breaking support. (see post here). Three weeks ago I shared...
