by Chris Kimble | Jun 1, 2017 | Kimble Charting
During the past 6 years, Gold bugs have seen opportunities come and go in a struggle to recoup the gold bull market magic of a decade ago. Many investors are aware of the US Dollar’s impact on the price of gold. In particular, it has been the US Dollar’s strength that...

by Chris Kimble | Dec 15, 2016 | Kimble Charting
The picture above came from the 1976 Movie “Bad News Bears.” If dual support below is taken out, it could easily become “Bad News For Metals Bulls!” In 2011, the Power of the Pattern suggested that Gold could be down for years, due to...

by Chris Kimble | Dec 7, 2016 | Kimble Charting
Gold Mining stocks started off the year like a rocket ship. Over the past 20-weeks, the popular Gold Miners ETF (GDX) has declined nearly 35%. This is one of its larger 20-week declines in its history! Create an opportunity? We think so! This decline has the Gold Bugs...

by Chris Kimble | Mar 17, 2016 | Kimble Charting
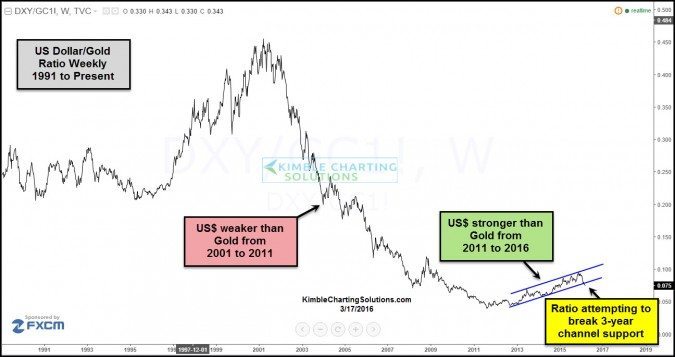
CLICK ON CHART TO ENLARGE The above chart looks at the U.S. Dollar/Gold ratio over the past 25-years. From 2001 to 2011, the ratio headed sharply lower, reflecting that the US$ was much weaker than Gold for almost a decade. Starting in 2011, the ratio has turned up,...

by Chris Kimble | Feb 3, 2016 | Kimble Charting, Metals
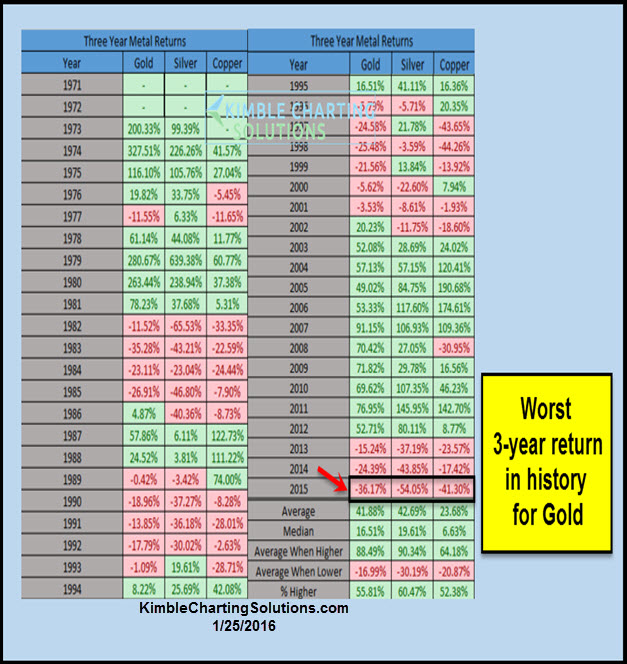
It’s been a rough 3-years for the metals space. “THE” worst 3-years in history for Gold and the 3rd worst 3-year performance in history, for Silver (see table below). The Power of the Pattern shared in 2011, that metals should be down for years to...

by Chris Kimble | Jan 25, 2016 | Kimble Charting, Metals
In the summer of the 2011, a rare set up was in place in the Gold and Swiss Franc markets. At the time the Power of the Pattern shared that Gold should be “Down for years to come.” See why we shared this near all-time highs in gold (HERE) Since that post,...

by Chris Kimble | Mar 11, 2015 | Kimble Charting, Metals
In 2011, I was pretty frank when I shared the following…”The Swiss Franc is suggesting Gold will be flat to down for years to come!” See post HERE Since that post, Gold has lost a third of its value and Silver around two-thirds. “Francly...

by Chris Kimble | Jan 16, 2015 | Kimble Charting, Metals
CLICK ON CHART TO ENLARGE It’s been a rough four years for Gold, as its declined around $700 (falling around 30%) from its high around $1,900 in 2011. Gold is “attempting” to change this trend! The Power of the Pattern suggested in 2011...


