by Chris Kimble | Mar 6, 2024 | Kimble Charting
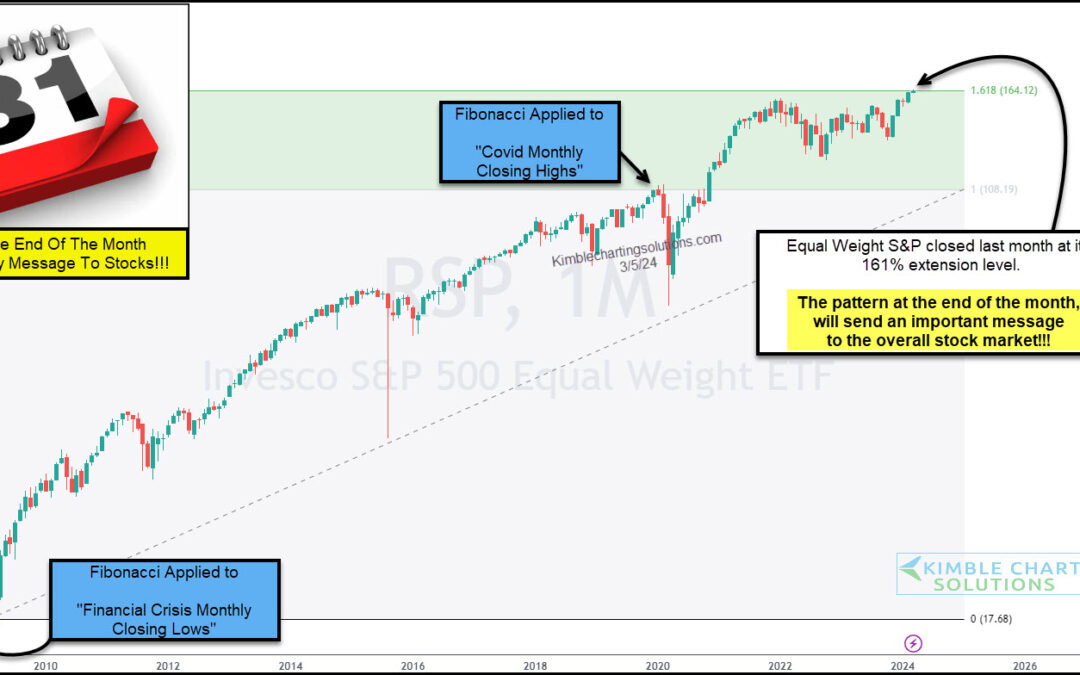
The latest stock market rally has taken several key indices to new highs. One such index is the Equal Weight S&P 500. While this is bullish, today’s long-term “monthly” chart of the Equal Weight S&P 500 ETF (RSP) shows price running into a big Fibonacci...
by Chris Kimble | Mar 5, 2024 | Kimble Charting
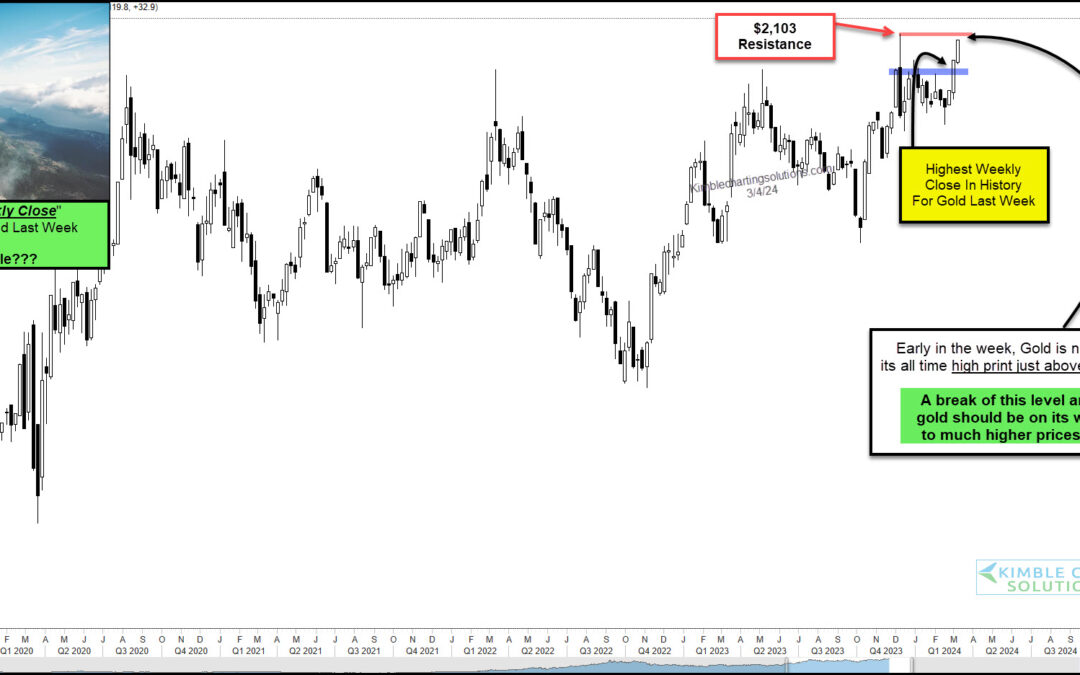
Precious metals may finally be nearing the rally that gold and silver bulls have been waiting for. Today, we simply focus on Gold from a “weekly” price perspective. And let’s just say that the recent price action has been bullish. Last week, Gold closed at its...
by Chris Kimble | Feb 29, 2024 | Kimble Charting
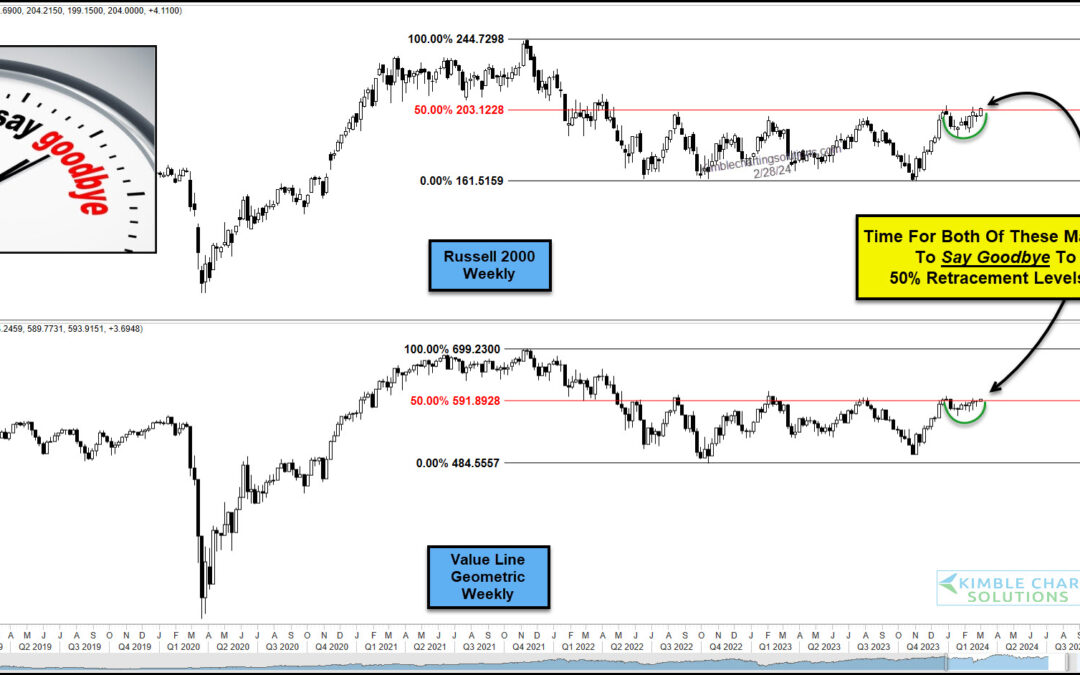
It is fair to say that the stock market has been lead higher by technology stocks and large cap stocks, in general. But two stock market indices that historically have been key to broad market rallies have under-performed: the small cap Russell 2000 Index and the...
by Chris Kimble | Feb 27, 2024 | Kimble Charting
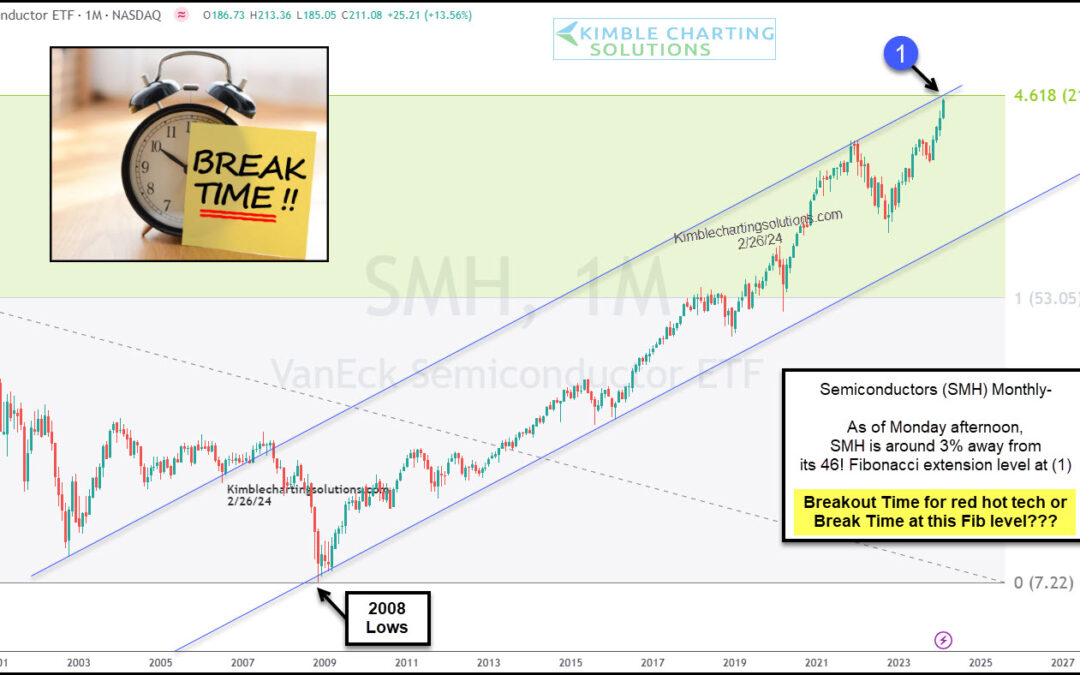
Investors have been treated to one heck of a rally by the Semiconductor Sector (SMH) with stocks like Nvidia (NVDA) leading the sector and stock market higher. But the semiconductor sector may be nearing a crossroads. Is it breakout time or break time for the red-hot...
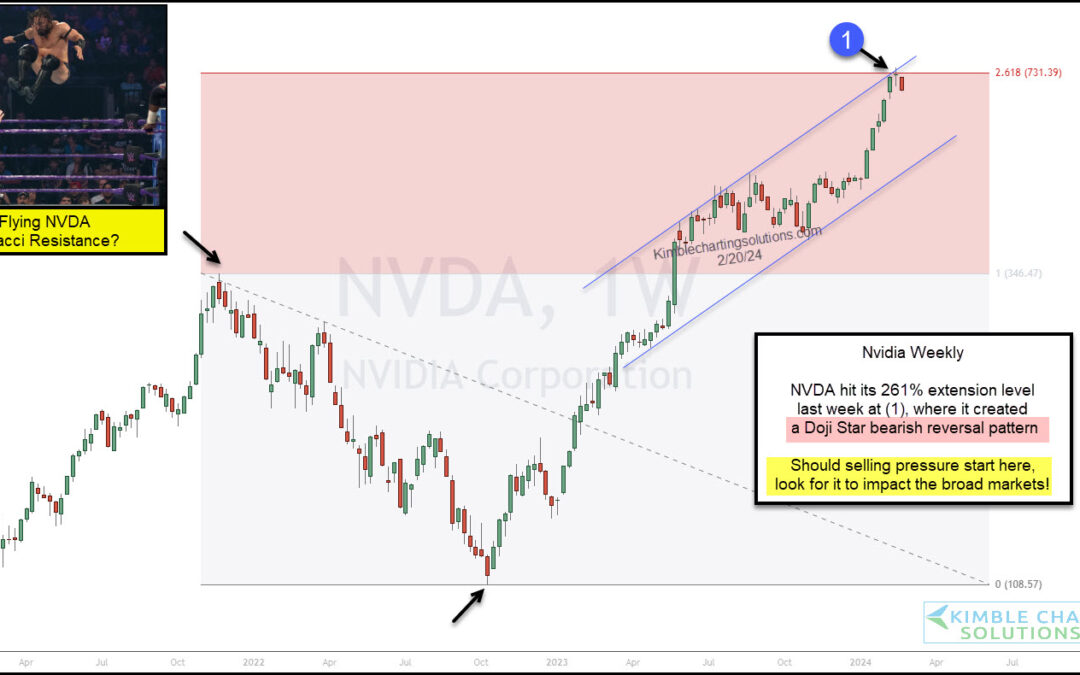
by Chris Kimble | Feb 21, 2024 | Kimble Charting
Nvidia has captured the technology investor community by storm. Nvidia’s stock price (ticker: NVDA) has surged in recent weeks and this has lead the broader stock market higher! But, as you can see on today’s “weekly” chart of Nvidia, the high flying NVDA hit its 261%...
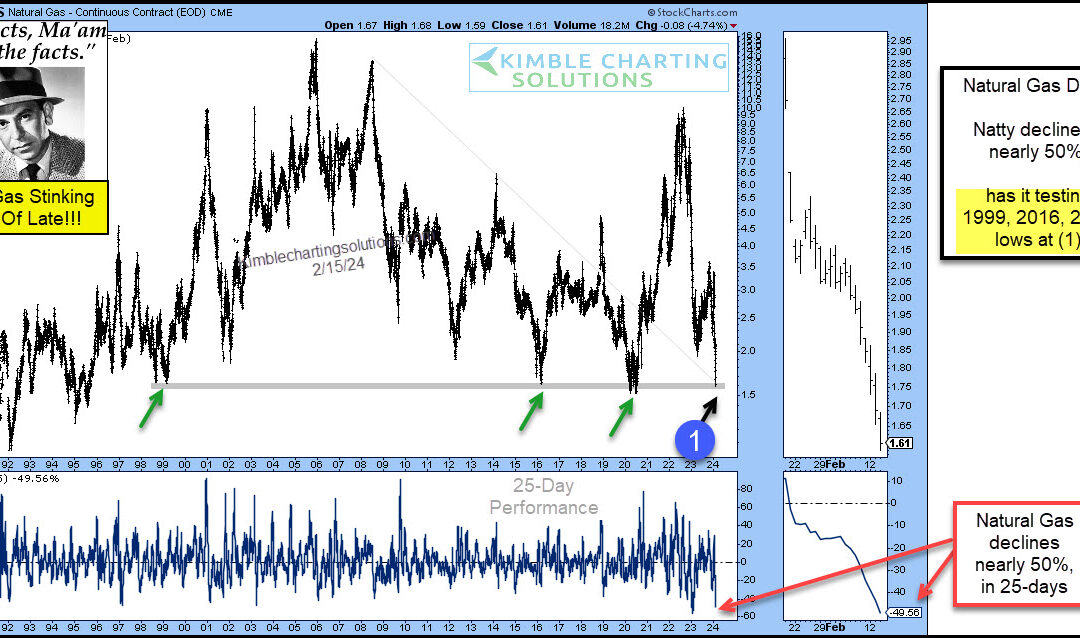
by Chris Kimble | Feb 16, 2024 | Kimble Charting
It’s been a rough go for Natural Gas prices. Even with elevated inflation numbers, Natural Gas is still in crash mode. “The facts, Ma’am. Just the facts.” – Joe Friday Today’s Natural Gas chart highlights the crash in Natural Gas prices. Natty has fallen nearly 50...
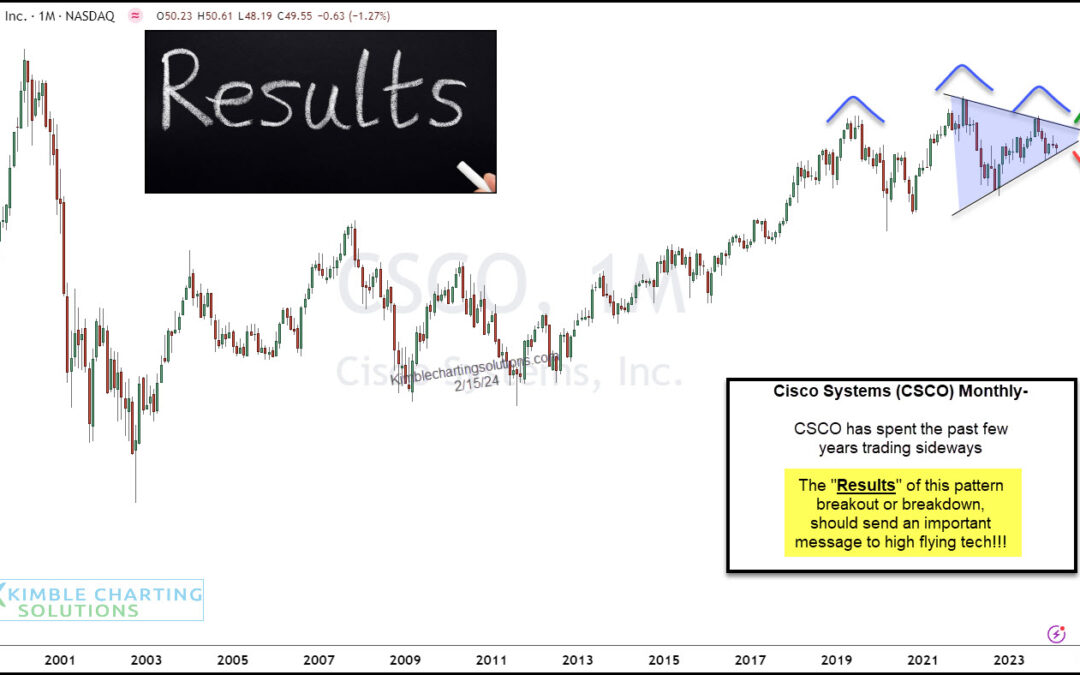
by Chris Kimble | Feb 16, 2024 | Kimble Charting
Cisco (CSCO) used to be one of the four horsemen of the Nasdaq (tech stocks) rally. While CSCO still has plenty of influence as a large-cap leader in the Semiconductor Sector, it is under-performing its peers and trading in a pennant pattern. In short, Cisco has...
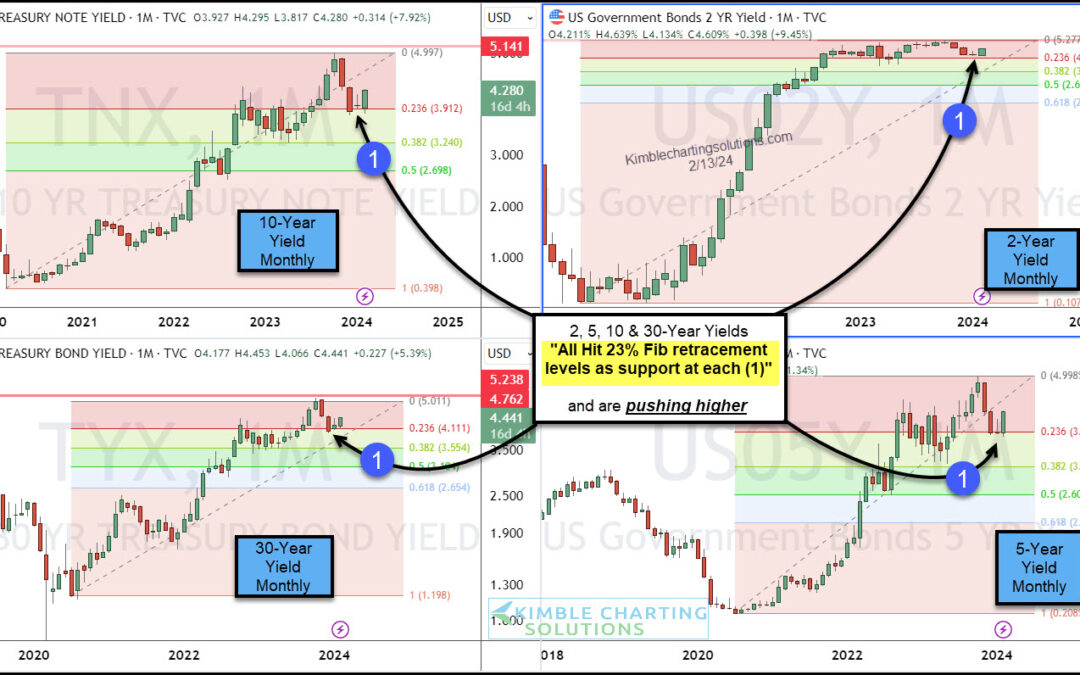
by Chris Kimble | Feb 14, 2024 | Kimble Charting
The past few months have given investors the feeling that the 3 year (monster) rally in treasury bond yields is over. But the lull may be over. And it’s looking like bond yields (interest rates) may be rallying again. Why? Well today’s chart 4-pack looks at treasury...
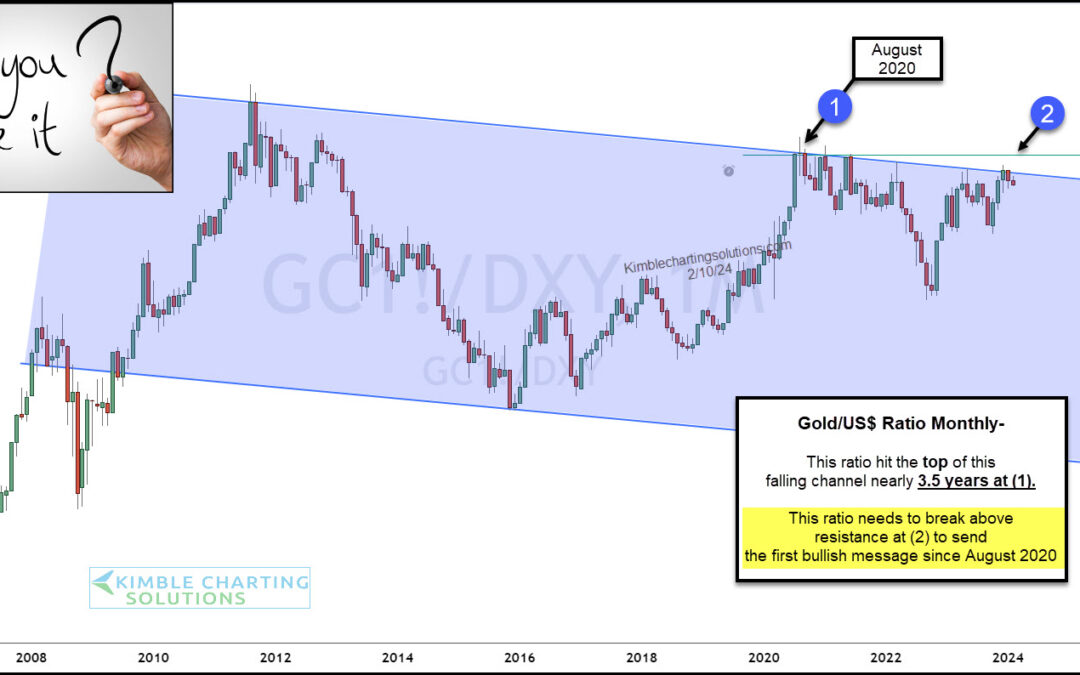
by Chris Kimble | Feb 13, 2024 | Kimble Charting
Gold prices remain elevated but have yet to record the major breakout that gold bulls are looking for. Today, we revisit an important Gold ratio that we have been following for months: the Gold to U.S. Dollar ratio. And above, you can see why. The long-term “monthly”...
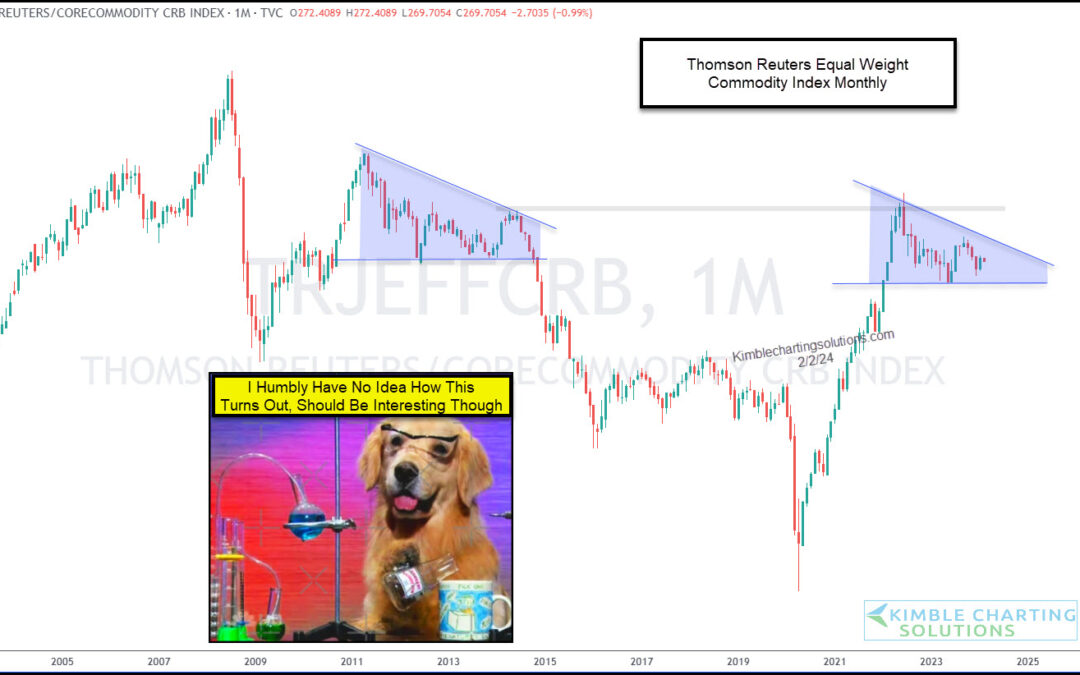
by Chris Kimble | Feb 5, 2024 | Kimble Charting
During the COVID pandemic, commodity prices soared. And this lead to a bout of inflation that we hadn’t seen in years. But commodity prices have leveled off and this has helped to keep inflation in check. This consolidation like pattern can be see on today’s “monthly”...

