by Chris Kimble | Feb 13, 2024 | Kimble Charting
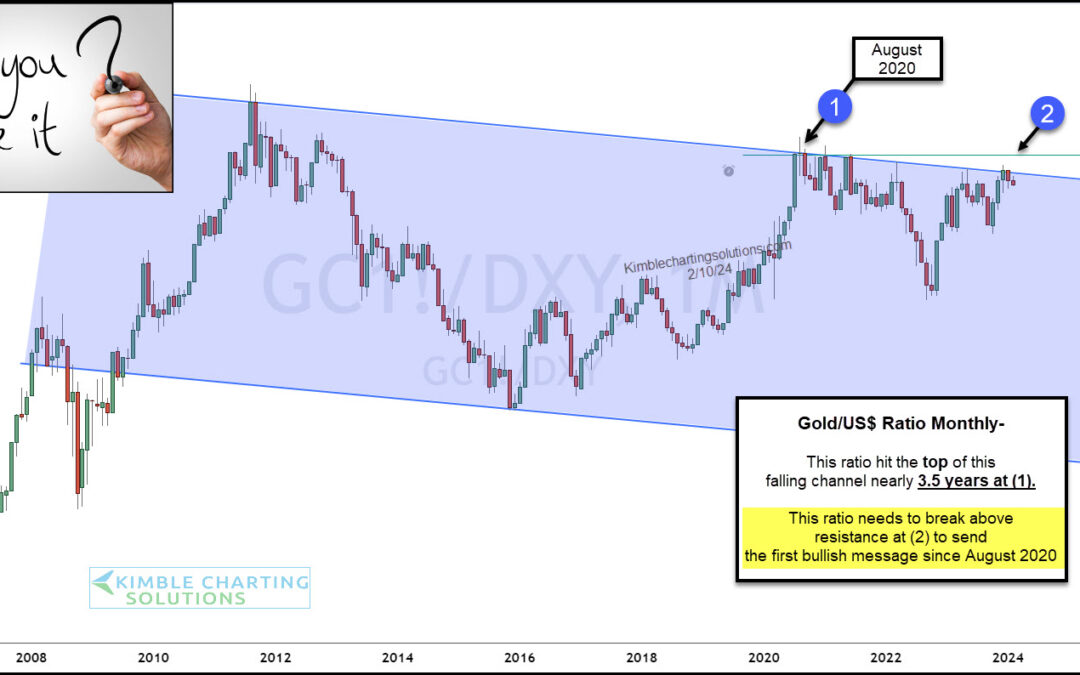
Gold prices remain elevated but have yet to record the major breakout that gold bulls are looking for. Today, we revisit an important Gold ratio that we have been following for months: the Gold to U.S. Dollar ratio. And above, you can see why. The long-term “monthly”...
by Chris Kimble | Feb 5, 2024 | Kimble Charting
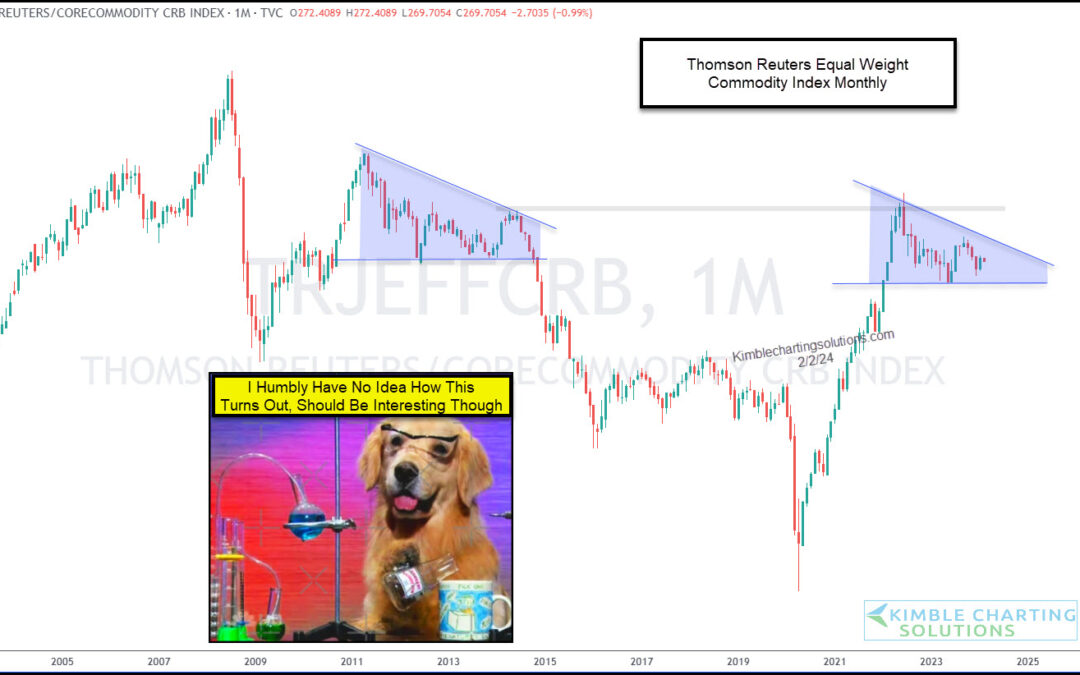
During the COVID pandemic, commodity prices soared. And this lead to a bout of inflation that we hadn’t seen in years. But commodity prices have leveled off and this has helped to keep inflation in check. This consolidation like pattern can be see on today’s “monthly”...
by Chris Kimble | Feb 2, 2024 | Kimble Charting
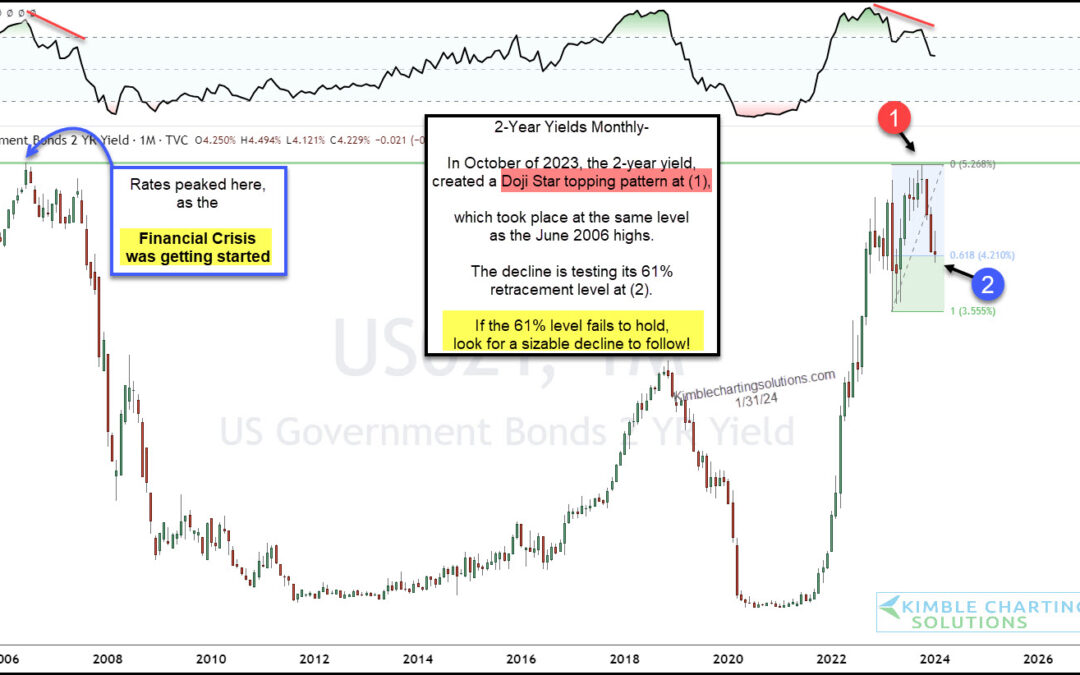
The Federal Reserve has paused its interest rate hikes and inflation data seems to be leveling off. We’ll see. All in all, bond yields (interest rates) are pulling back and investors are hopeful that we have a soft landing. Looking at today’s long-term “monthly” chart...
by Chris Kimble | Feb 1, 2024 | Kimble Charting
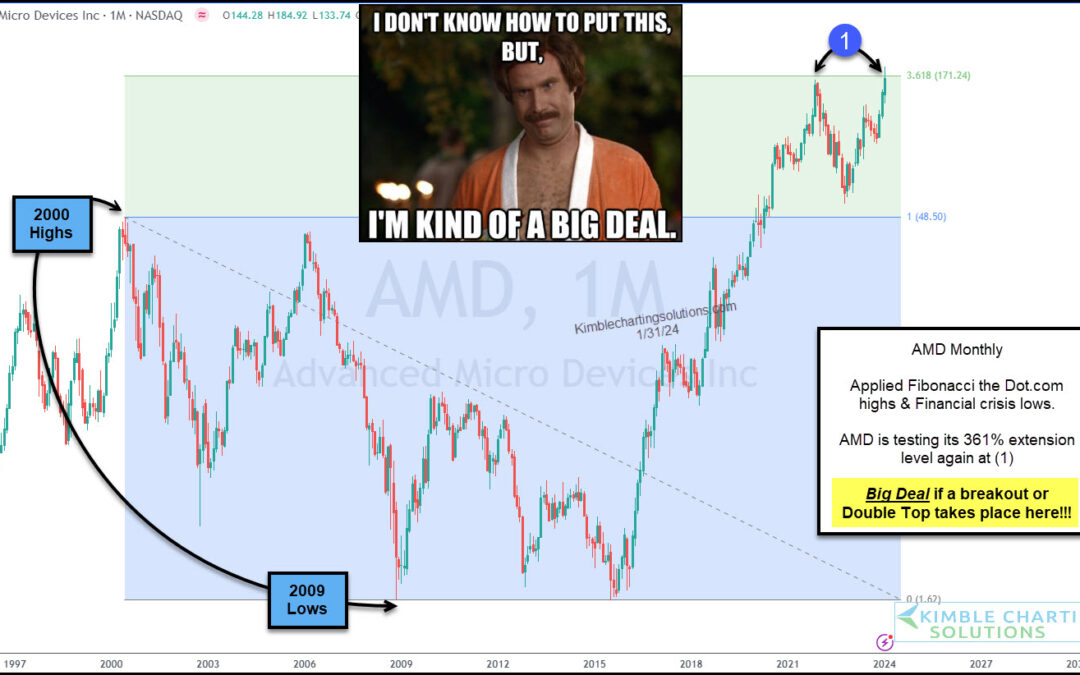
Semiconductor stocks have been leading technology stocks higher. And today’s Semi stock has been red hot: Advanced Micro Devices (AMD) As you can see on the “monthly” chart below, AMD has been ripping higher in recent months. But it’s important to note the shaded...
by Chris Kimble | Jan 29, 2024 | Kimble Charting
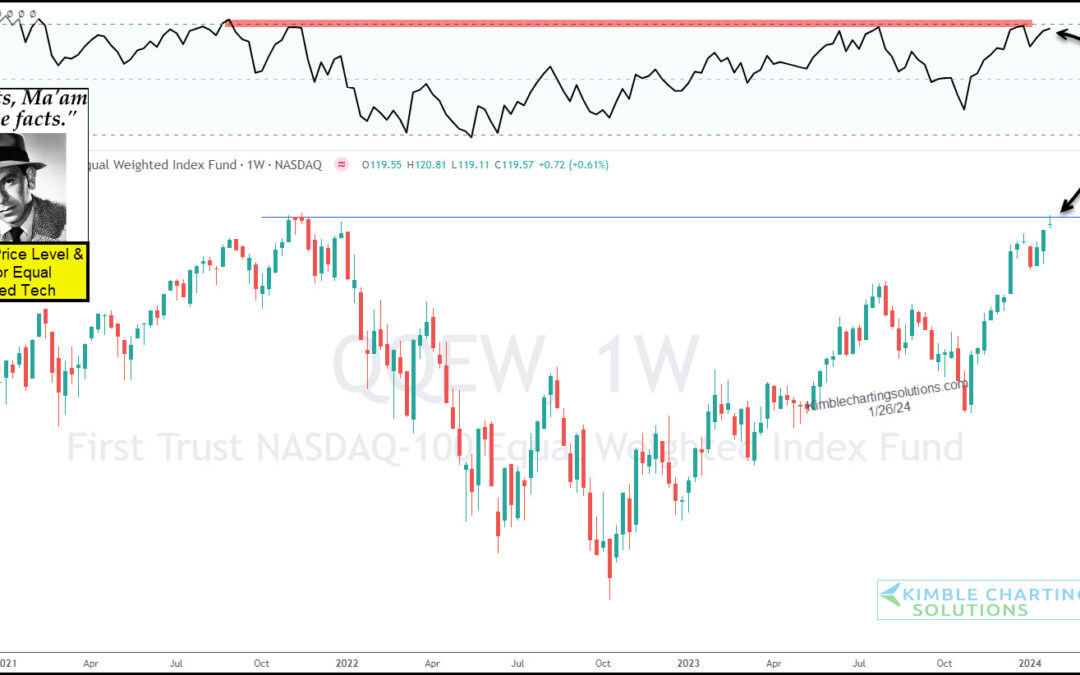
The end of year rally has trickled over into 2024 and it has been lead by tech stocks. But has the rally gotten long in the tooth? “The facts, Ma’am. Just the Facts.” – Joe Friday Today’s “weekly” chart of the Nasdaq 100 Equal Weight Fund (QQEW) highlights an...
by Chris Kimble | Jan 25, 2024 | Kimble Charting
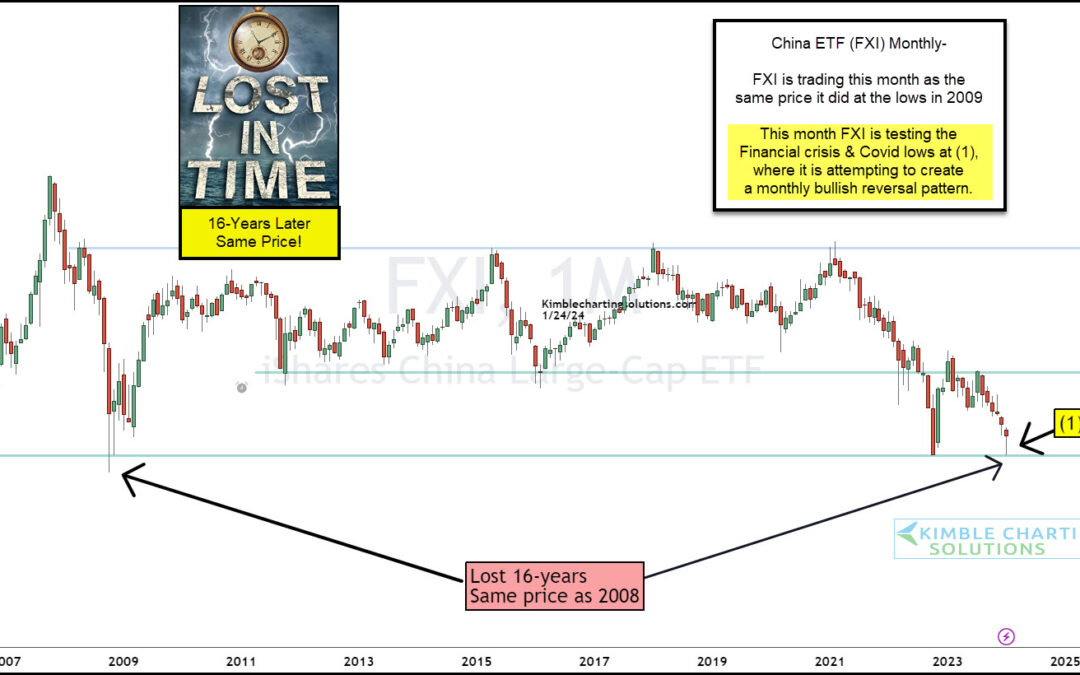
It’s been over 15 years since China’s equity market was in a long-term bullish position. Now, don’t get me wrong- there have been plenty of medium-term trends to trade and make money, but the long-term chart for the major China ETF (FXI) has traded sideways since the...
by Chris Kimble | Jan 24, 2024 | Kimble Charting
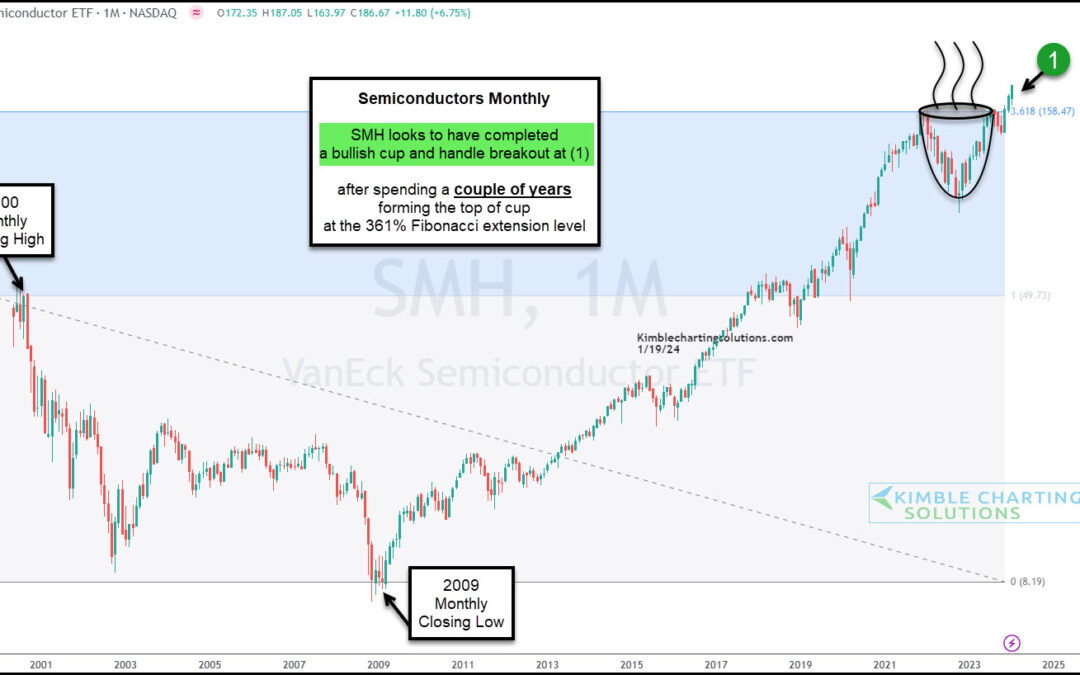
Not too long ago, we wrote about a potential cup with handle breakout for the market-leading Semiconductors ETF (SMH). You can read that here. Today, we examine a “monthly” chart of $SMH to provide an update on that powerful price pattern. As you can see, a breakout...
by Chris Kimble | Jan 22, 2024 | Kimble Charting
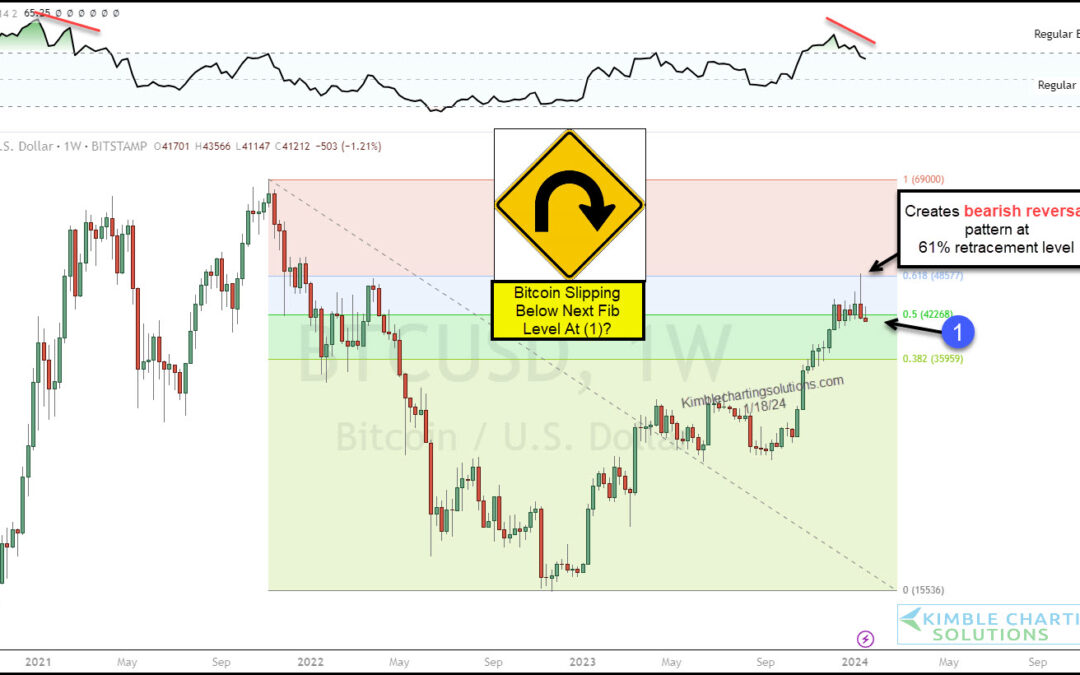
Bitcoin chatter is rising again. With new ETFs coming to market, crypto investors are getting very bullish. Is this a good thing? Or is too much bullishness about to send Bitcoin spiraling? Today we look at a long-term “weekly” chart with Fibonacci levels to show why...
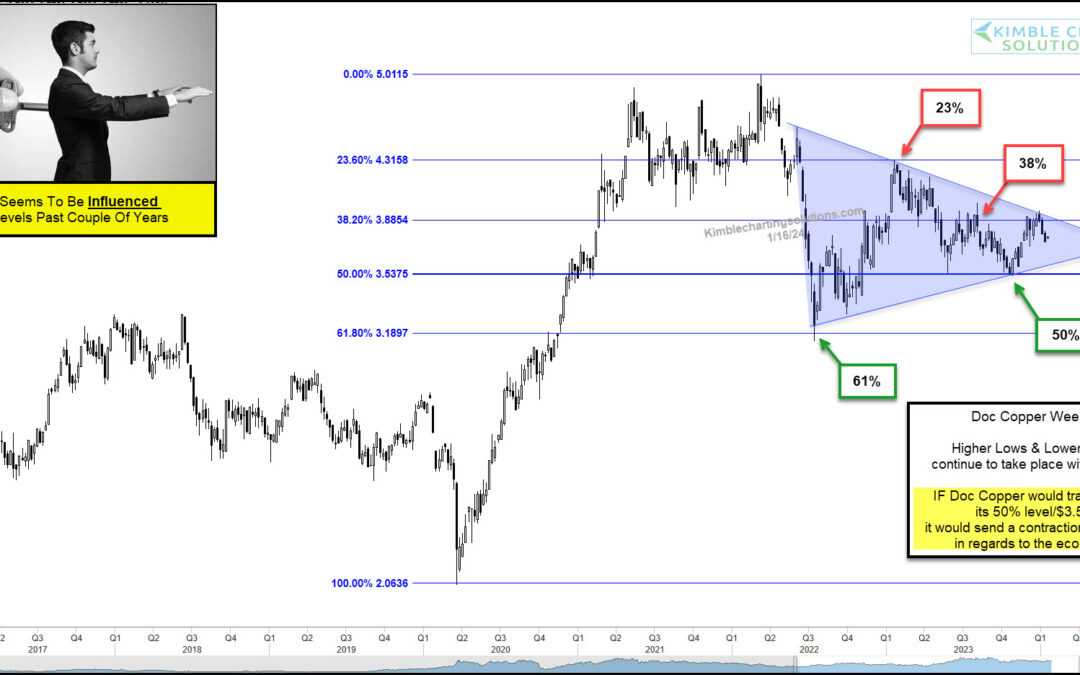
by Chris Kimble | Jan 17, 2024 | Kimble Charting
After peaking in 2021, copper prices declined sharply before bouncing around for a few years. That “bouncing” ended up following the twists and turns of Fibonacci rules. And we can see this in today’s “weekly” chart of Copper. Yes, Doc Copper seems to be under the...
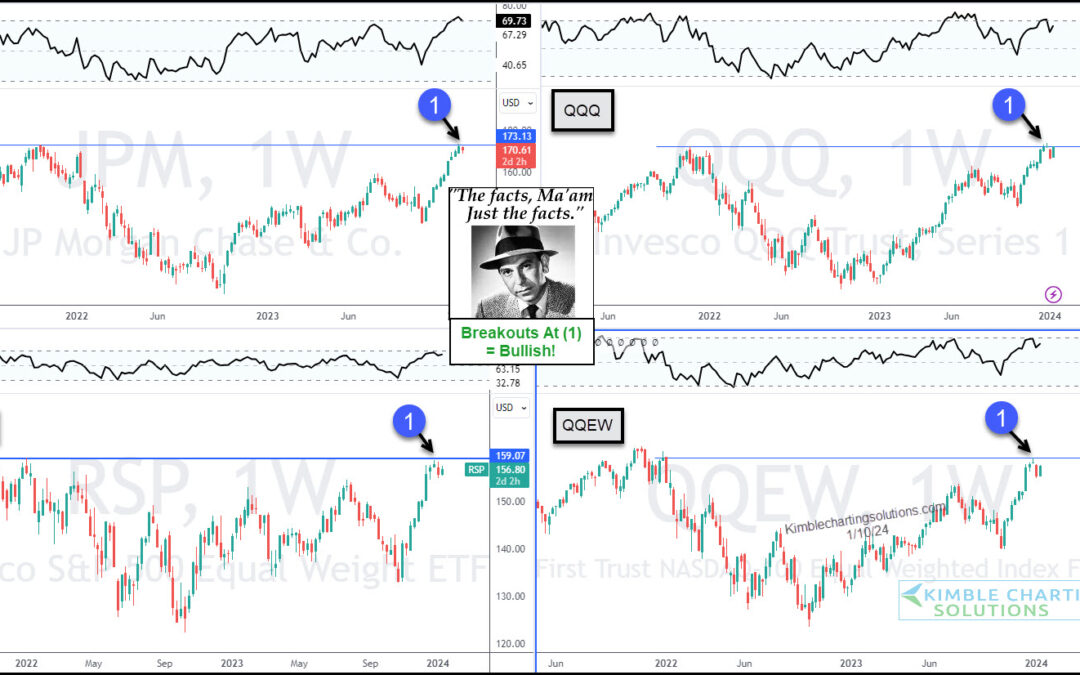
by Chris Kimble | Jan 12, 2024 | Kimble Charting
After a big year-end rally, the stock market attempts to consolidate gains in January. That consolidation has several stock indices and ETFs trading near recent price highs. “The facts, Ma’am. Just the facts.” – Joe Friday Today’s chart 4-Pack highlights a key bank...

