877-721-7217 services@kimblechartingsolutions.com
  • Twitter
  • Twitter
  • Terms of Use
  • Contact
0 Items
Kimble Charting Solutions
  • Blog Sign Up
  • Free Research (Blog)
  • Research Subscriptions
    • Most Popular Research
    • Premium Member Research
    • Weekly Research Reports
  • What We Do
    • What We Do For You
    • Charts Solve These Investing Challenges
    • What You Receive
  • About Us
    • About Us
    • Testimonials
    • Videos
    • As Seen On
  • Login
Select Page
Interest rates only done this two times in 35-years!

Interest rates only done this two times in 35-years!

by Chris Kimble | Dec 6, 2016 | Kimble Charting

Interest rates have shot up since this past July. Have they “stretched too far too fast?”  One way to measure if an asset has made a rare/extreme short-term move, is too see how far above or below its 200 day moving average, it is. Below looks at the yield...
S&P 500 200-Day Moving Average Is Pointing Lower, What’s Next?

S&P 500 200-Day Moving Average Is Pointing Lower, What’s Next?

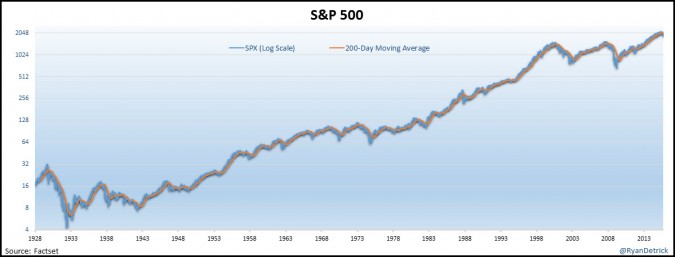
by Chris Kimble | Sep 9, 2015 | Global Dashboard, Kimble Charting

  Today’s post is from my good friend Ryan Detrick. He had some unique thoughts and stats on the 200-day moving average, Thank You Ryan for your contributions! We hear a lot about the S&P 500 and its 200-day moving average.  It is trading above or below...

Topic Areas

10-year yield Apple Banks bonds China Commodities Copper CRB Index Crude Oil DAX Doc Copper Dollar Update Dow Jones Emerging Markets Euro GDX gdxj gld gold Gold Bugs Gold Stocks Govt. bonds High Yields Interest Rates Joe Friday Junk Bonds Kimble Charting NASDAQ 100 ndx 100 NYSE Composite QQQ real estate Russell 2000 S&P S&P 500 Shanghai index silver slv SPX spy TLT US dollar What would you do? Wilshire 5000 Yields
  • Terms of Use
  • Contact
  • Twitter

Copyright ©2023 Kimble Charting Solutions. All Rights Reserved | Design by 16Wells