by Chris Kimble | Jan 11, 2024 | Kimble Charting
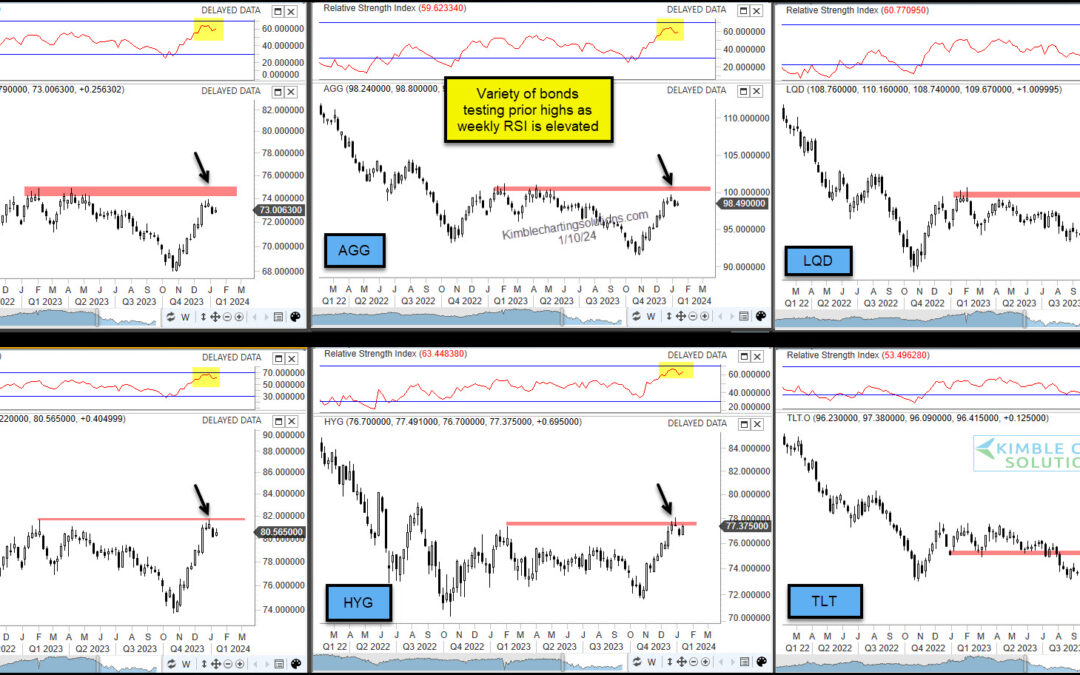
When interest rates fall, bond prices rise. And while it has been some time since we’ve been able to say interest rates are dropping, the past few months have done just that. The pullback in interest rates is coinciding with investors optimism that the Federal Reserve...

by Chris Kimble | May 14, 2015 | Kimble Charting
CLICK ON CHART TO ENLARGE Did key bond ETF’s create long-term double tops over the past couple of years? The above 3-pack takes a look at three different bond ETF’s. AGG and LQD earlier this year attempted to break above 2012 highs. At this time it looks...

by Chris Kimble | May 28, 2014 | Kimble Charting
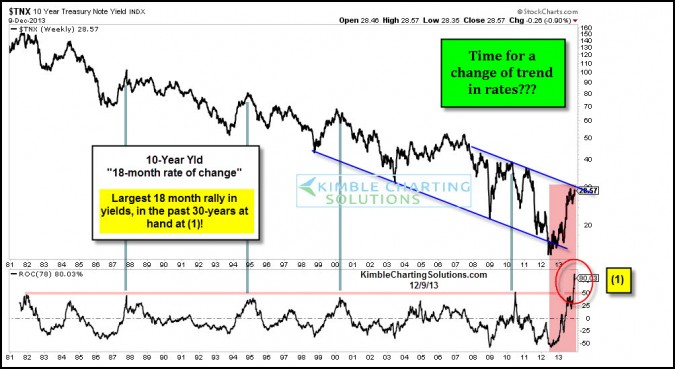
CLICK ON CHART TO ENLARGE If an asset rose 50% more than than its seven biggest rallies in 30 years, would you say that is closer to the norm or closer to an aberration? In my humble opinion, it seems closer to an aberration. Almost 6 months ago I shared...

by Chris Kimble | Oct 22, 2013 | Kimble Charting, Sector / Commodity
CLICK ON CHART TO ENLARGE The above 6-pack reflects a wide variety of bonds and yields. The upper left two charts highlights heavy falling channel resistance in the 10 & 30-year yield, which are now breaking support. The other 4 charts high light breakouts in...

by Chris Kimble | Aug 13, 2013 | Kimble Charting
CLICK ON CHART TO ENLARGE A wide variety of bonds have been under pressure since their May highs. This doesn’t just apply to Government bonds! The above 4-pack reflects a cross section of bonds (Govt, High Quality Corp & Junk Bonds) that have been weak...

by Chris Kimble | Aug 1, 2013 | Kimble Charting
CLICK ON CHART TO ENLARGE Wiley Coyote’s sign in the above chart says it best…this is what owners of Government bonds need right now! The Power of the Pattern suggested “Rates were ready to blast off and Bond prices could get hurt big time” due...

by Chris Kimble | Jun 10, 2013 | Kimble Charting
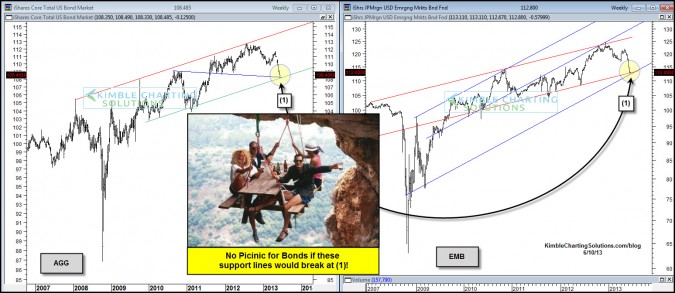
CLICK ON CHART TO ENLARGE Aggregate Bond ETF (AGG) and Emerging Markets Bond ETF (EMB) have declined rather sharply of late. The declines has taken each of them down to multi-year support lines at (1) in the charts above. This 2-pack reflects that interest rates...

by Chris Kimble | Mar 10, 2013 | Kimble Charting
CLICK ON CHART TO ENLARGE Muni Bond ETF (MUB) is breaking its second support line and its 200-SMA line at (1) this past week. Is it doing something other bonds are not? Diversified Bond ETF (AGG) is close to breaking support of a multi-year rising channel in the...


