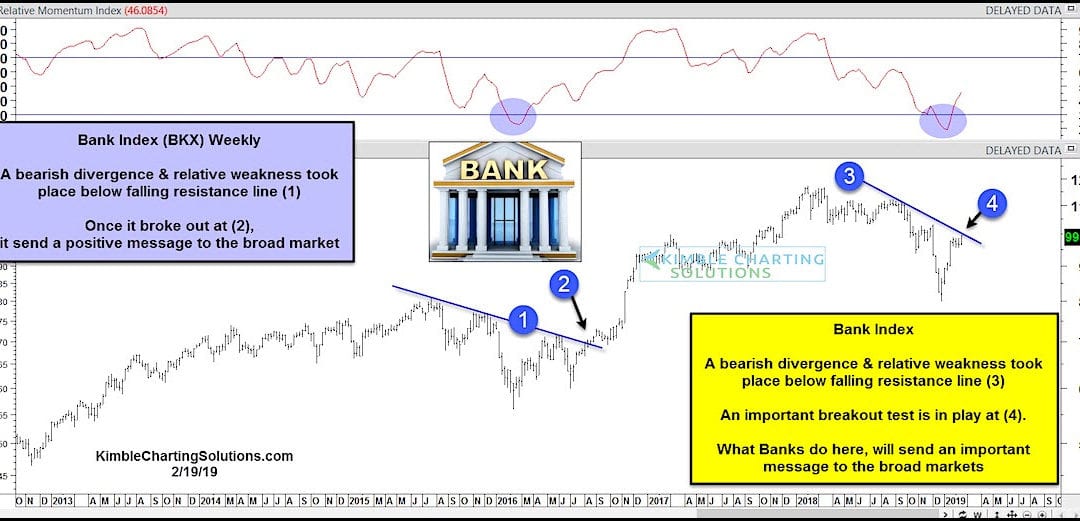
by Chris Kimble | Feb 20, 2019 | Kimble Charting
The bank sector is a good indicator of the health of the broader stock market. Bulls like to see the banks in a leadership role because it indicates that the economy is doing well. But when they begin to lose momentum and underperform, it often leads to pullbacks and...
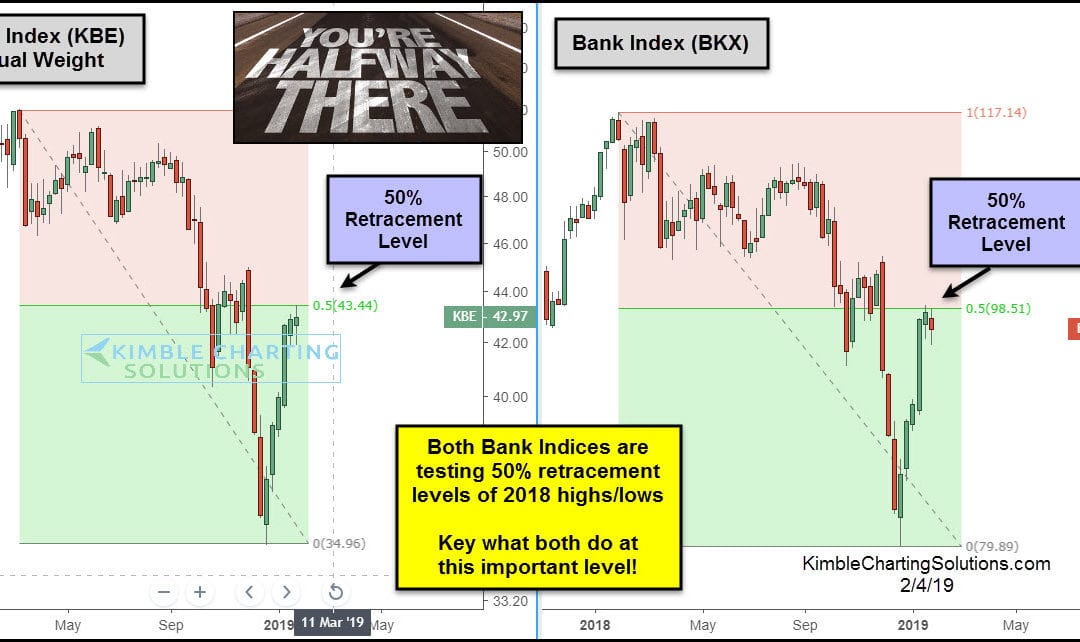
by Chris Kimble | Feb 4, 2019 | Kimble Charting
The Banking sector often sends a very important message to the broad market. Banks are at a price point where they could send a very important message to the overall market. This 2-pack looks at the Banking Index (BKX) and the Equal Weight Bank Index (KBE) over the...
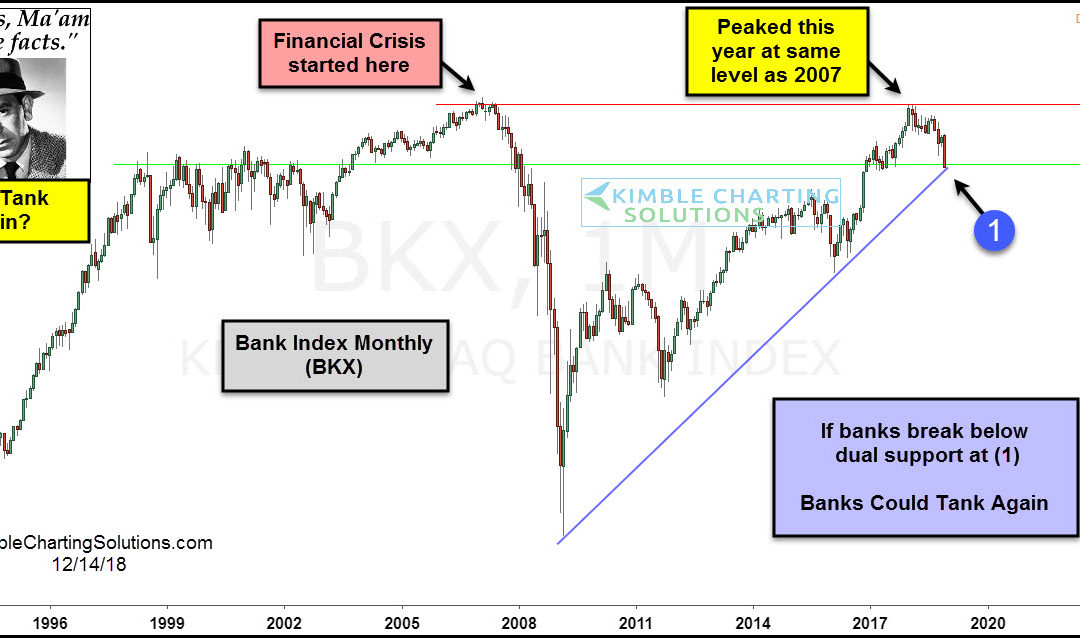
by Chris Kimble | Dec 14, 2018 | Kimble Charting
This chart looks at the Bank Index (BKX) over the past 25-years on a monthly basis, reflecting that currently, the 9-year trend in the index remains up. The index may have created a double top this year, at the same level the financial crisis started unfolding back in...
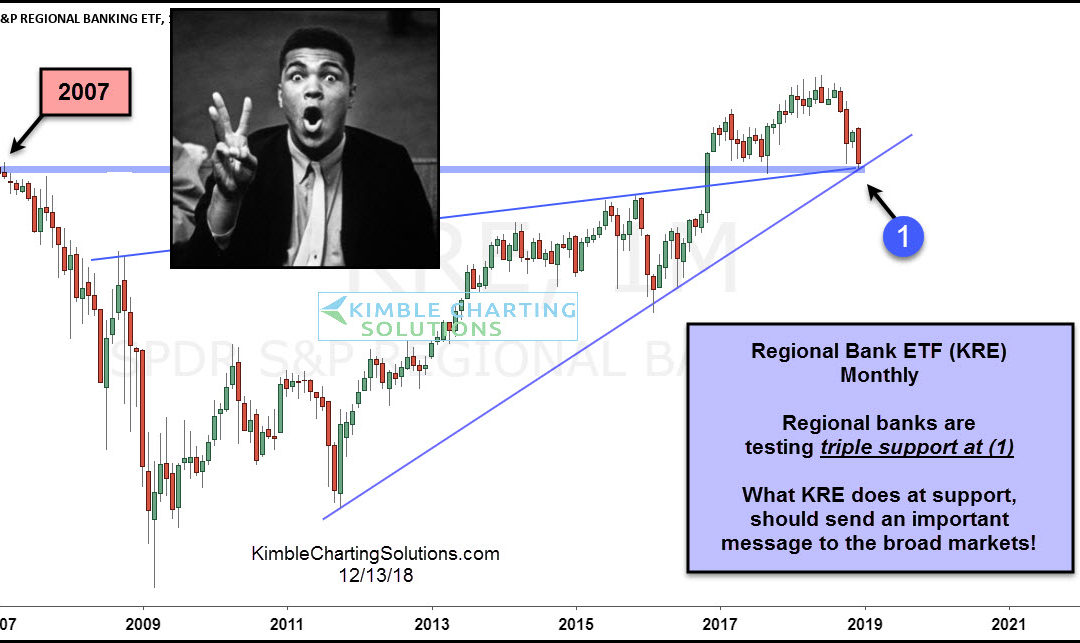
by Chris Kimble | Dec 13, 2018 | Kimble Charting
Large and Regional banks have struggled this year, as both indices have declined nearly 15% in 2018. These declines have taken place as interest rates have been moving higher, which historically is positive for banks. The declines of late in Regional Bank ETF (KRE)...
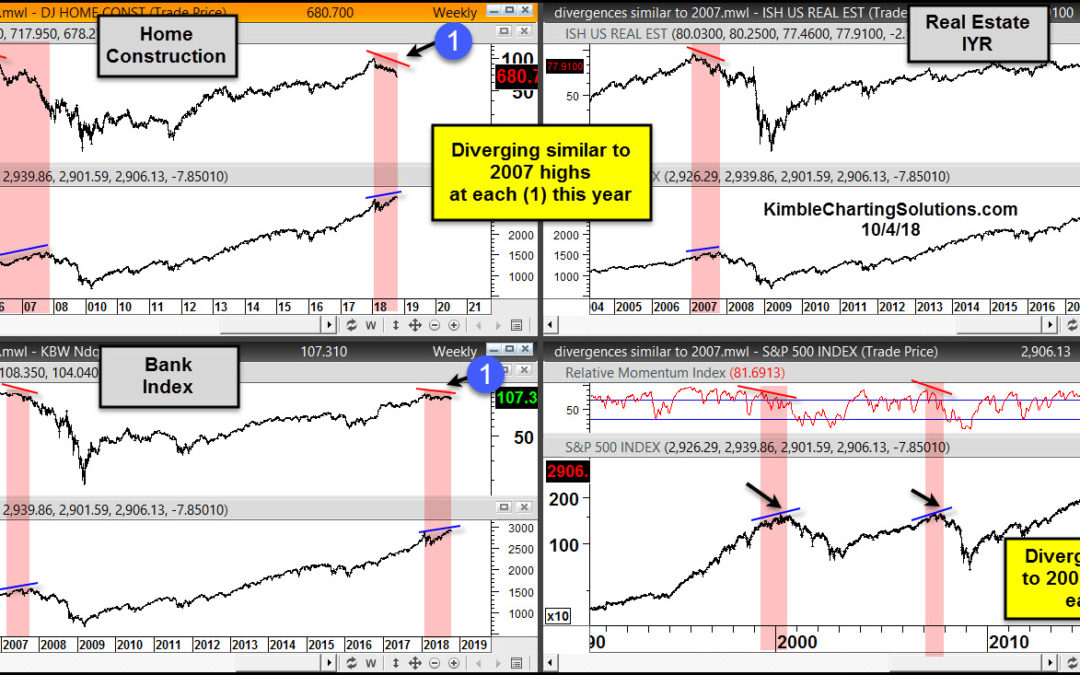
by Chris Kimble | Oct 6, 2018 | Kimble Charting
We did an earlier chart reflecting that home builders are diverging similar to 2007. Housing is a critical component to the economy and stock market, as we found out a decade ago. And unfortunately, current housing market concerns don’t end there. There are several...
by Chris Kimble | Jun 1, 2018 | Kimble Charting
During the stock market correction and current consolidation, we have received several mixed signals and indicators. The Dow Jones Industrials, Nasdaq, Banks, and Semis all hit key long-term resistance in early 2018 and pulled back. This isn’t necessarily bearish, but...

by Chris Kimble | Apr 6, 2018 | Kimble Charting
CLICK ON CHART TO ENLARGE This chart looks at the Bank Index over the past 17-years on a monthly basis. The index has remained inside of a bullish rising channel (A) since the lows in 2011. The rally over the past 7-years took it to the top of this channel and back to...
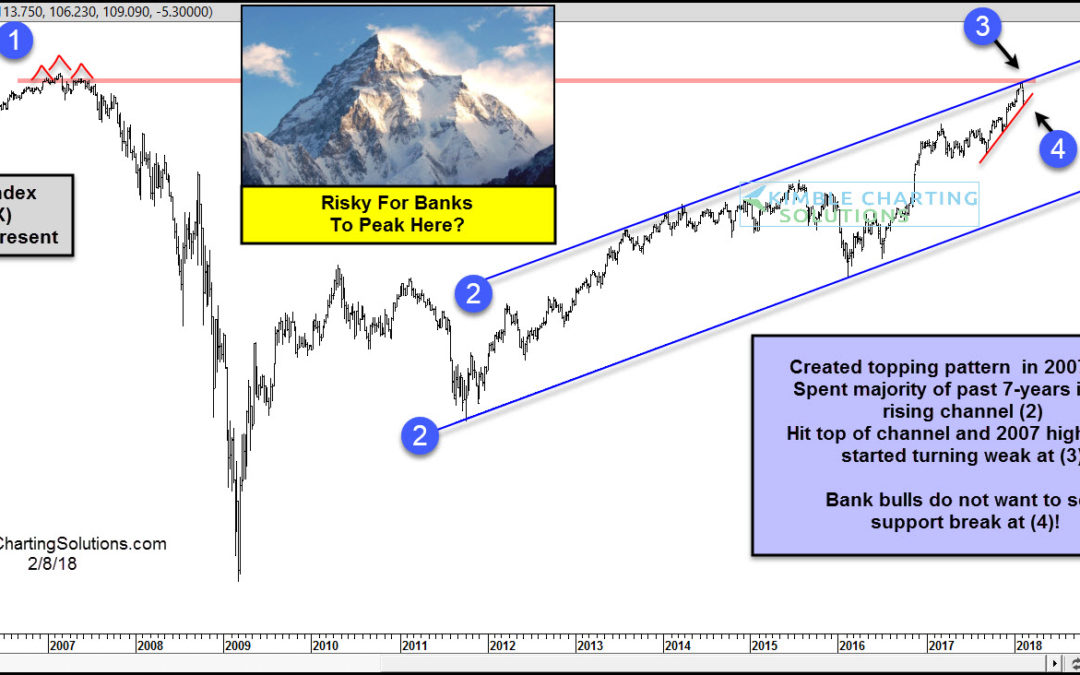
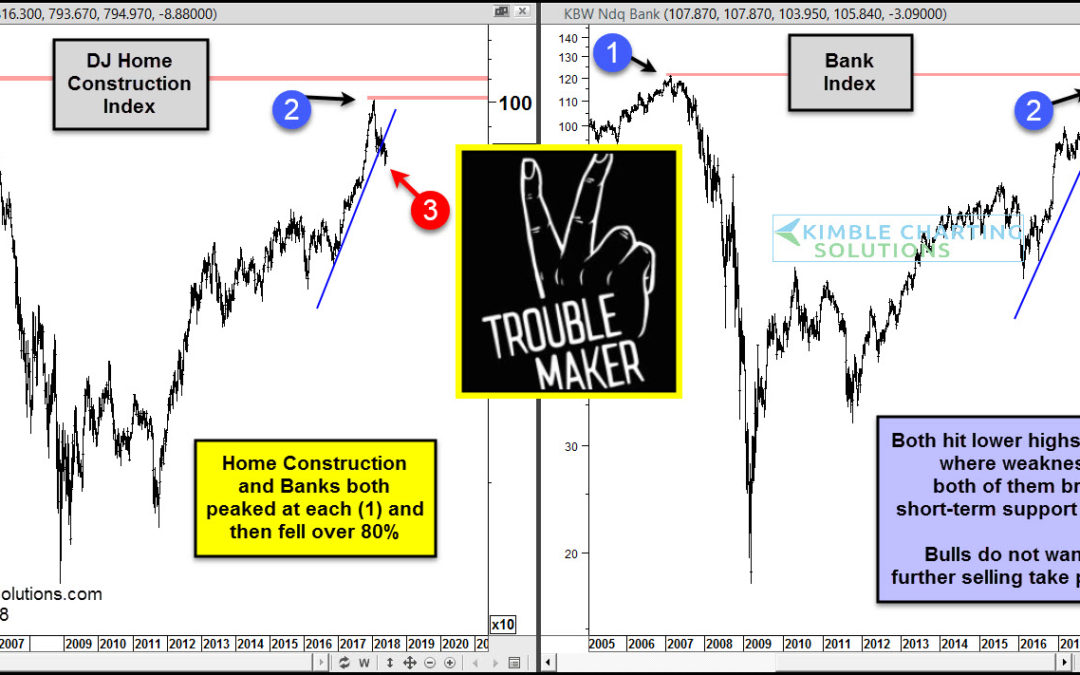
by Chris Kimble | Feb 8, 2018 | Kimble Charting
CLICK ON CHART TO ENLARGE The chart above looks at the Bank Index over the past 13-years. In 2007 at (1), the index created a topping pattern, prior to the financial crisis and its 80% decline over the next couple of years. The rally in banks over the past 7-years...
