
by Chris Kimble | Jan 30, 2018 | Kimble Charting
Banks started showing cracks back in 2007 and before long they started breaking support and fell hard. The current bank trend remains UP at this time. The trend finds itself back at 2007 highs, where bulls would NOT want to see selling pressure start taking place!...

by Chris Kimble | Oct 24, 2017 | Kimble Charting
Some question if “Pigs Can Fly.” I don’t know if they can or can’t, of late though, Piggy Banks are flying high and breaking out. We have highlighted positive bank patterns of late and three weeks ago we shared that the banking sector was...
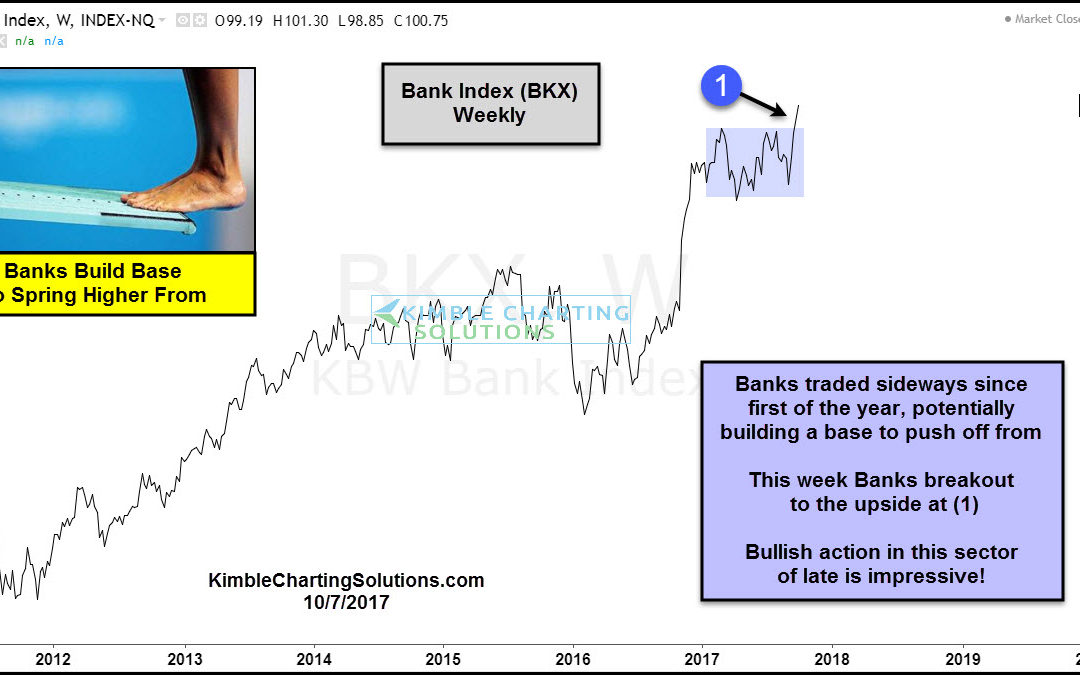
by Chris Kimble | Oct 7, 2017 | Kimble Charting
Since the first of this year, banks didn’t have much to brag about, as they lagged the broad market to the upside. While lagging, they potentially built a base that could reward the owners of banks for a while going forward. Below looks at the Bank Index (BKX)...

by Chris Kimble | Aug 17, 2017 | Kimble Charting
Historically stocks tend to “Start” to get soft this time of year. Below looks at the average performance of the S&P 500 during the month of August over the past 10 & 20-years. CLICK ON CHART TO ENLARGE The typical decline in August is...

by Chris Kimble | Dec 22, 2010 | Kimble Charting
Shared on 12/9 that a breakout in the Bank Index (BKX) was taking place and to pick up the banking etf XLF (see post here) Since then the BKX index has moved up around 5% more. CLICK ON CHART TO ENLARGE The banking/financial arena continue to reflect...
