by Chris Kimble | Jul 19, 2019 | Kimble Charting
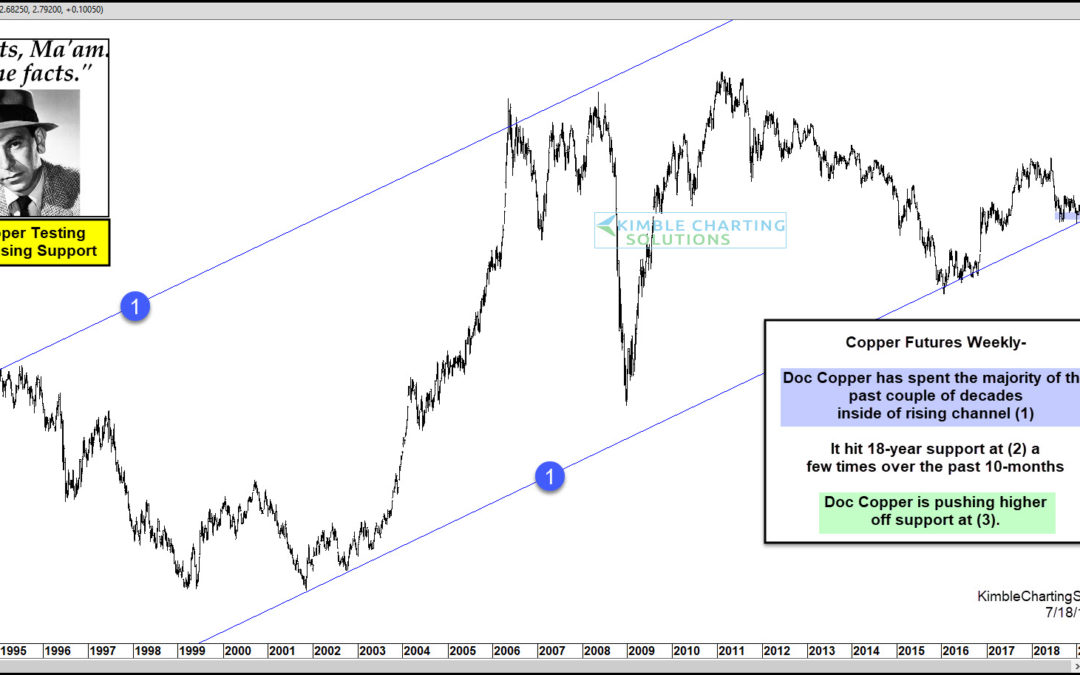
Gold & Silver have been hot of late! Is Doc Copper about to do the same? Possible says Joe Friday. This chart looks at Copper Futures over the past 27-years. Copper has spent the majority of that time inside of rising channel (1). The decline over the past year...
by Chris Kimble | May 1, 2019 | Kimble Charting
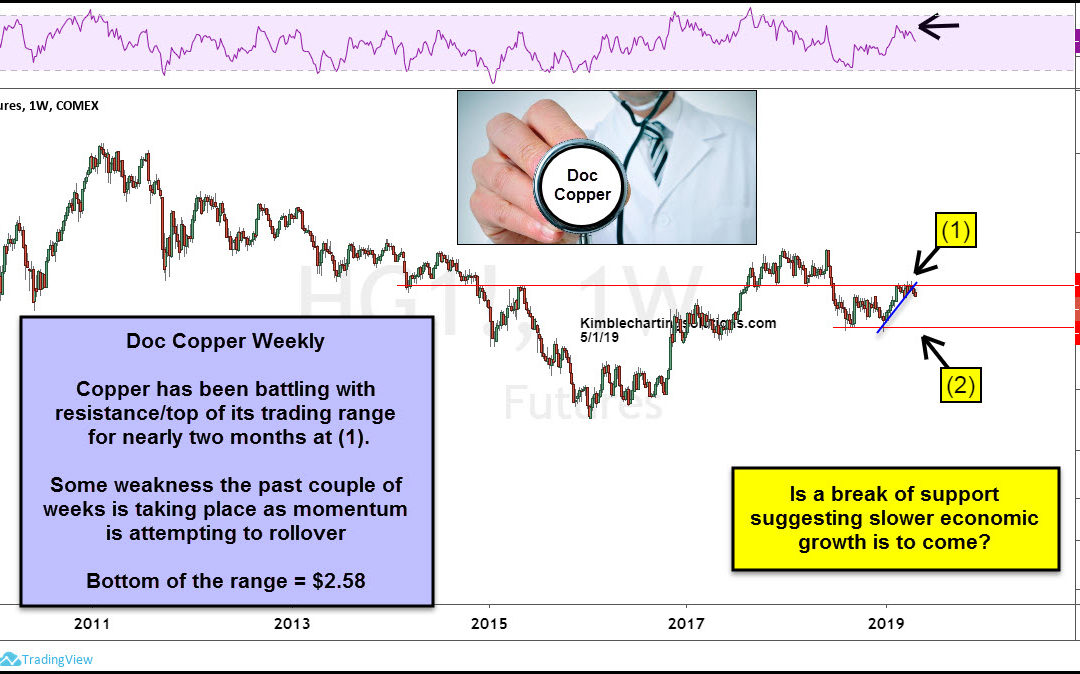
Is Doc Copper of late suggesting the economy is about to slow down? Possible! Copper futures have remained in a trading range since last summer, with resistance around $2.95 and support near $2.60. Over the past couple of months, Doc Copper has traded sideways near...
by Chris Kimble | Mar 14, 2019 | Kimble Charting
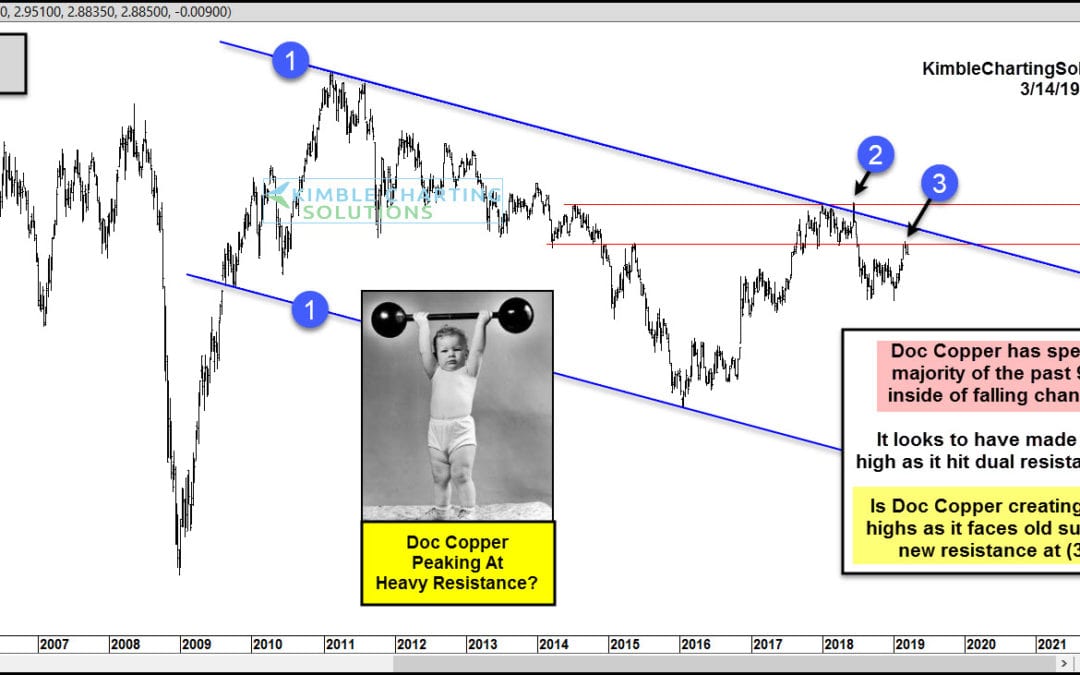
Is Doc Copper suggesting that economic weakness is around the corner? Possible Doc Copper has created a series of lower highs and lower lows over the past 9-years inside of falling channel (1). Last year Copper looks to have double topped at 2014 highs and the top of...

by Chris Kimble | Sep 21, 2018 | Kimble Charting
CLICK ON CHART TO ENLARGE Doc Copper over the past few months has been hit hard, as sellers drove it down nearly 25%. This decline brought it to the price point (2), where four different support lines came into play, which looks like a support cluster. As the decline...
by Chris Kimble | Aug 20, 2018 | Kimble Charting
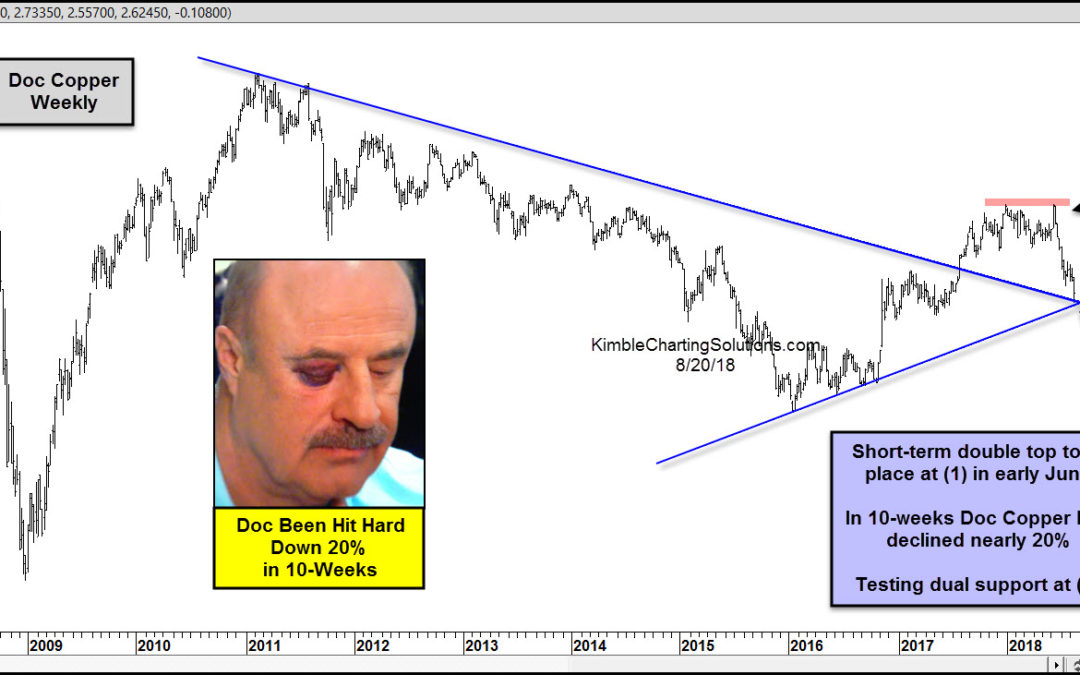
CLICK ON CHART TO ENLARGE Doc Copper has had a rough go of it over the past 7-years and especially of late. Since the highs back in 2011, Doc Copper has created a series of lower highs and lower lows. Since the lows in 2015, it has experienced a strong rally, creating...
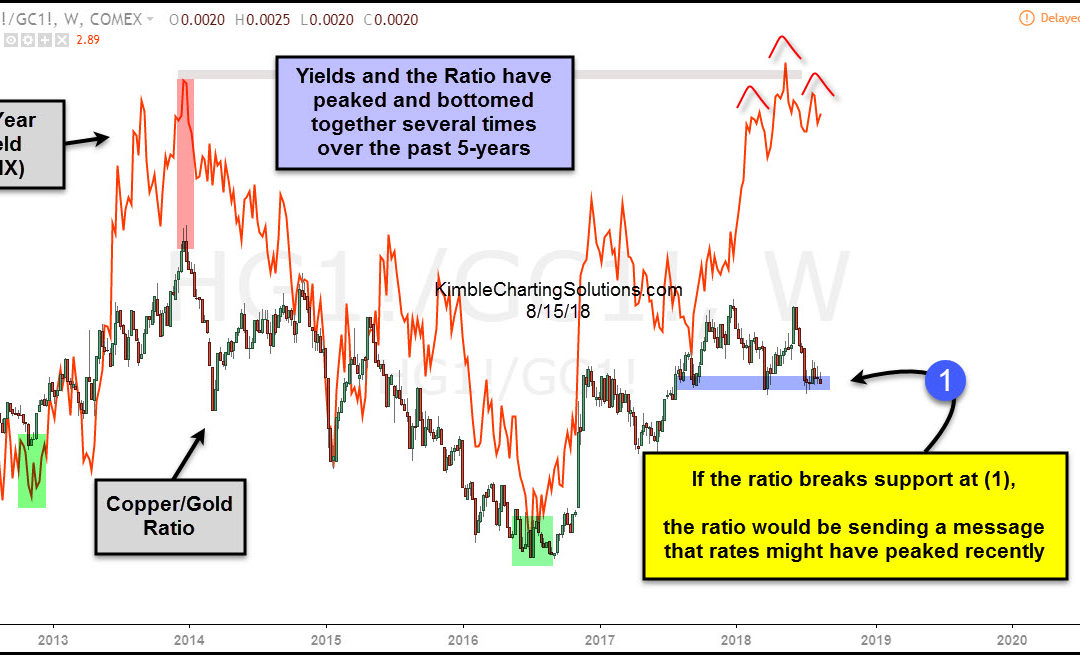
by Chris Kimble | Aug 16, 2018 | Kimble Charting
If you spend time researching market relationships you can better understand money flows, rotation, and reasons why money flows rotate. This can be very helpful in identifying trend changes as well. Today, we’ll look at the relationship between 10 Year US Treasury...
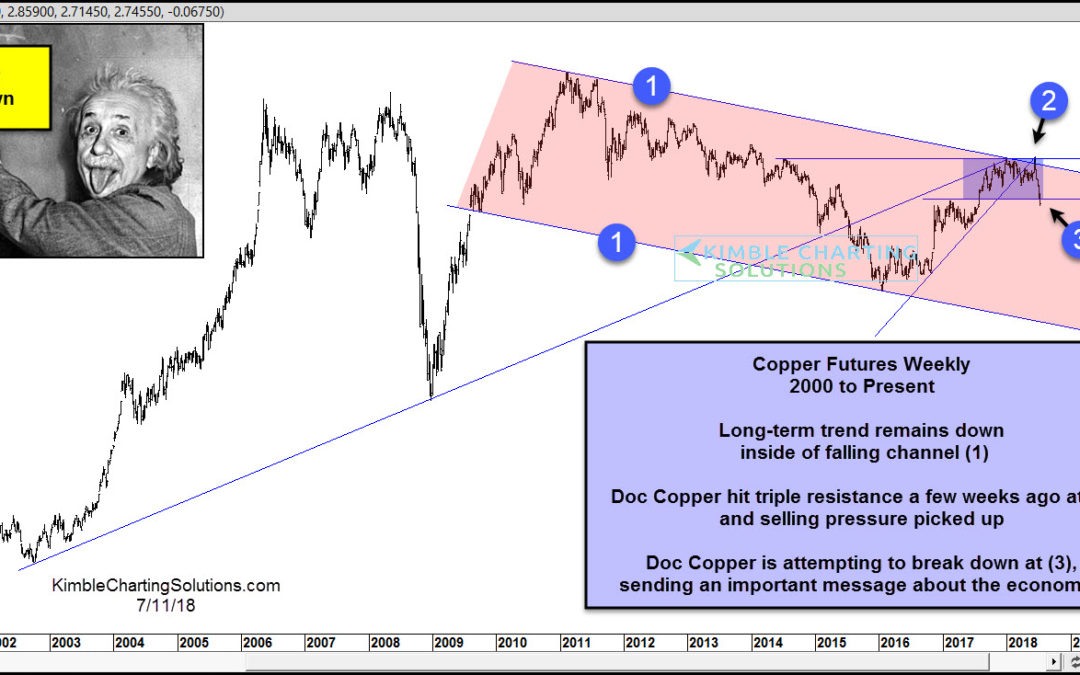
by Chris Kimble | Jul 11, 2018 | Kimble Charting
CLICK ON CHART TO ENLARGE Some view Doc Copper as an indicator of economic strength. If you are in this camp, it is facing an important price point. Doc Copper remains in a long-term downtrend; as it peaked in 2011 and has created a series of lower highs and lower...
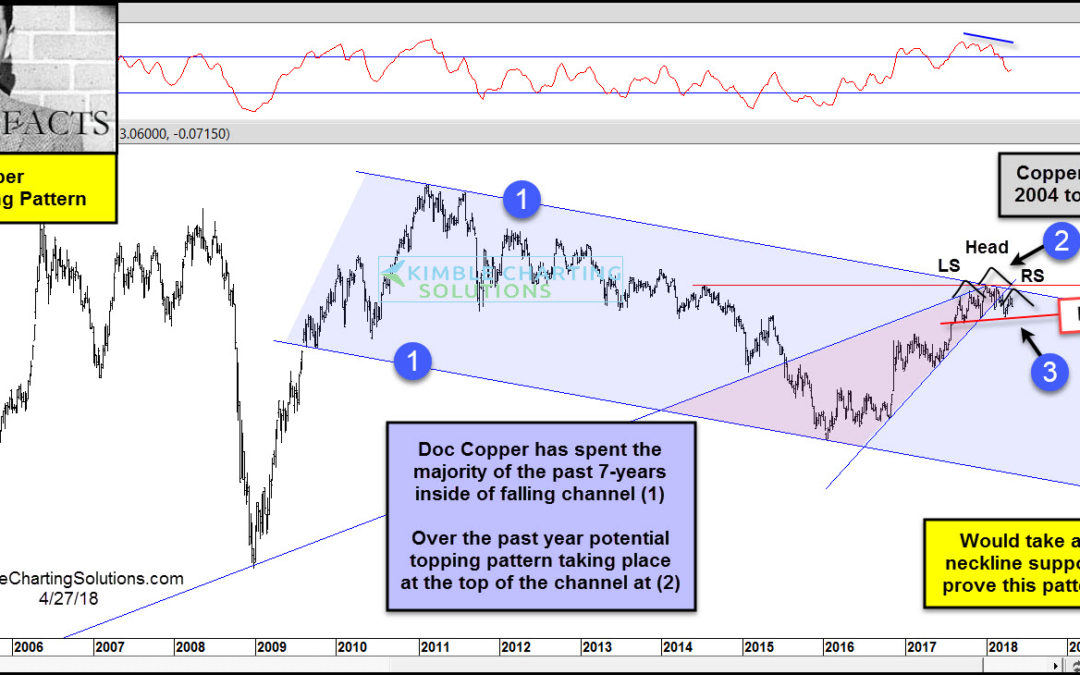
by Chris Kimble | Apr 27, 2018 | Kimble Charting
CLICK ON CHART TO ENLARGE The long-term trend of Doc Copper remains down, as it has created a series of lower highs and lower lows inside of falling channel (1) over the past 7-years. It hit the bottom of the channel in late 2015, where it found support and a rally...
