by Chris Kimble | Apr 3, 2012 | Kimble Charting
On 5/14/2011 the 6-pack below was posted, as the “Power of the Pattern” was reflecting - multi-year bearish rising wedges were taking place around the world and rising wedges two-thirds of the time results in lower prices (see 5/14 post here) . The...

by Chris Kimble | Mar 20, 2012 | Kimble Charting
Emerging markets outperformed the S&P 500 by 300% in the time period below- CLICK ON CHART TO ENLARGE Since May of last year, the 500 index has out performed EEM by roughly 15%, reflecting relative underperformce in the Emerging markets. The patterns...

by Chris Kimble | Dec 8, 2011 | Kimble Charting
The “Power of the Pattern” reflected below that markets around the world had created bearish patterns back in May, reflecting a two-thirds chance they would all move lower (see post here) From a portfolio construction standpoint…Risk can be viewed as...

by Chris Kimble | Sep 21, 2011 | Kimble Charting
I am honored that one third of this blogs viewers come from outside of the United States. Of late I have received numerous email requests from the international viewers, to update the look of the Emerging markets. See below… CLICK ON CHART TO...

by Chris Kimble | Aug 4, 2011 | Kimble Charting
The “Power of the Pattern” started highlighting that markets looked very much alike on 5/14 and the global patterns looked like a “Domino/Slippery Slide Effect” should be CLOSE at hand. (see look alike, dominoes and...

by Chris Kimble | Jul 15, 2011 | Kimble Charting
The 6-pack below reflects DIFFERENT MARKETS from around the world….yet they very much have LOOK ALIKE PATTERNS! CLICK ON CHART TO ENLARGE This 6-pack is a great reflection of how correlated the worlds markets have become. Some of the...

by Chris Kimble | Jun 3, 2011 | Kimble Charting
On 5/14 I ran a post discussing “Look Alikes, Domino’s and Slipper Slides.” (see original post here) Below is an update to the prior Global 6-pack, which at that time, was reflecting that key global markets had created “bearish...

by Chris Kimble | May 17, 2011 | Kimble Charting
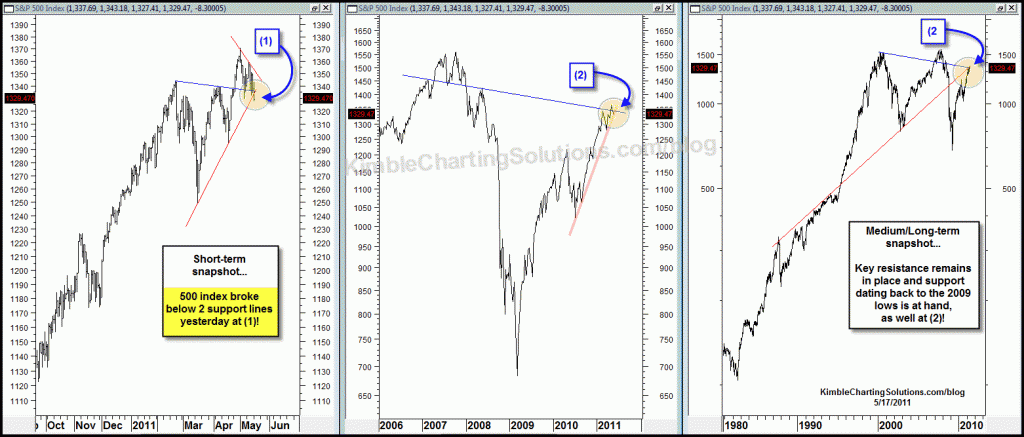
CLICK ON CHART TO ENLARGE On a very short-term basis, the 500 index broke below two support lines yesterday at (1). This break doesn’t determine a ton, nor create a trend, yet it should be respected! On a bigger picture, the 500 index remains jammed...


