by Chris Kimble | Nov 23, 2022 | Kimble Charting
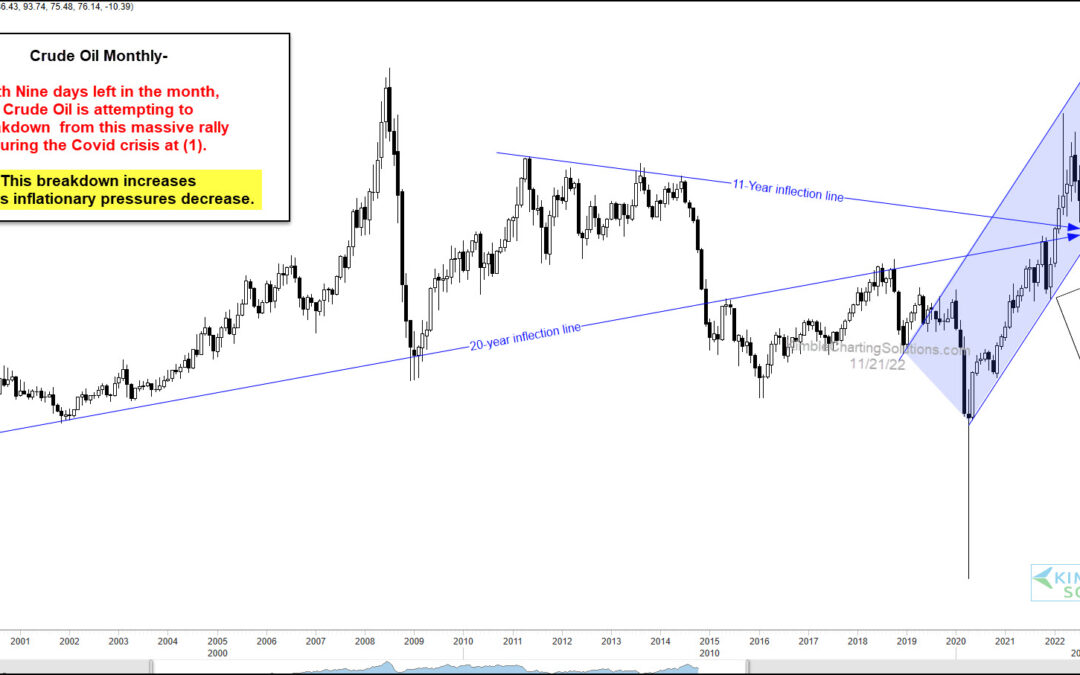
Crude oil prices rose sharply in 2022 and this has been a major factor in rising consumer prices and inflation. But the past five months have seen oil prices pull back… and this has been welcome news at the gas pump! With the holidays fast approaching, consumers are...
by Chris Kimble | Jul 6, 2022 | Kimble Charting
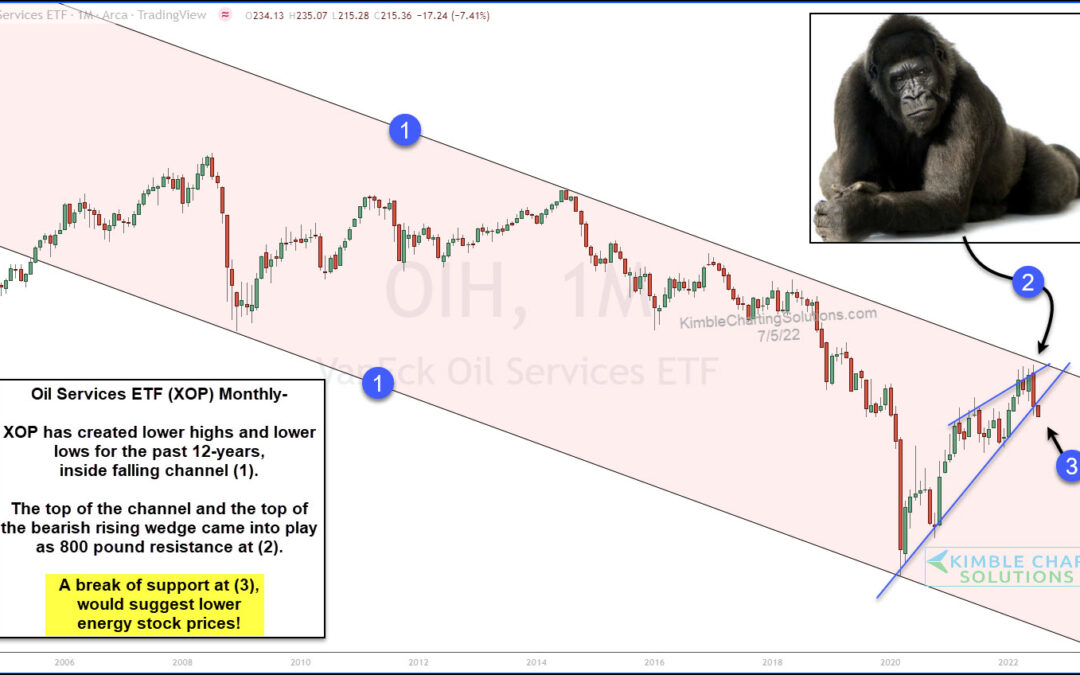
A couple weeks ago, we warned that energy stocks might be in trouble. We’ve followed and analyzed the entire trend higher for oil and commodities and, now, we are on technical support watch and concerned about commodities breaking down. Today we revisit the Oil...
by Chris Kimble | Jun 24, 2022 | Kimble Charting
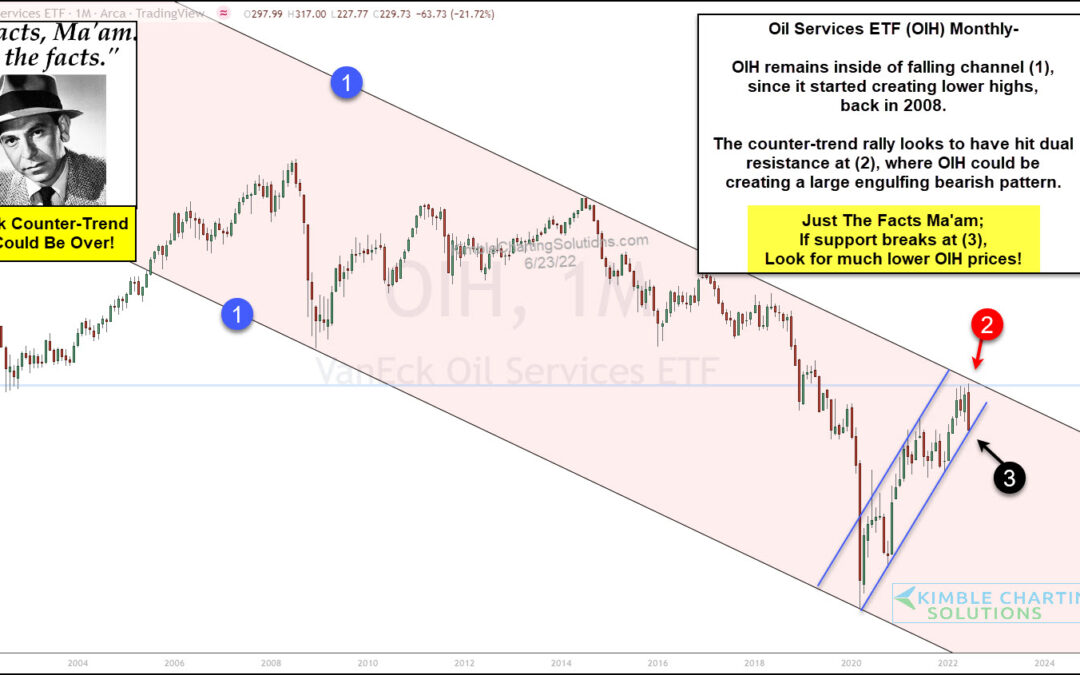
For over 2 years, all crude oil prices did was go higher… and higher. And consumers have been feeling this pain as the gas pump. Well, this month crude oil prices turned sharply lower joining the broad based commodities selloff. Could this be the start of a long...
by Chris Kimble | May 10, 2022 | Kimble Charting
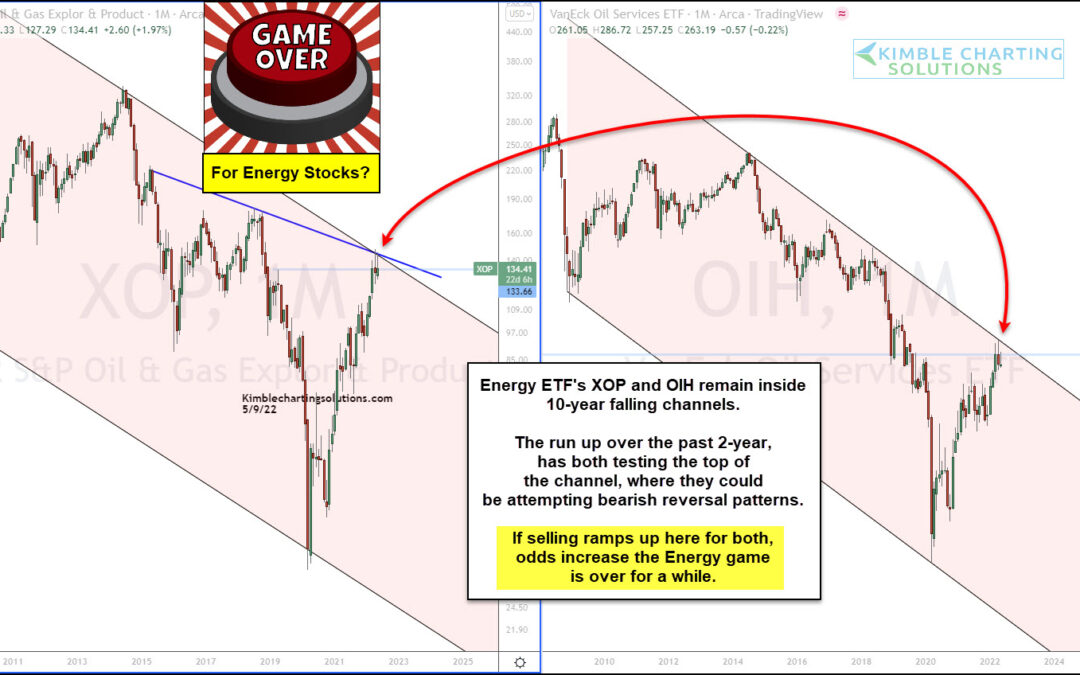
There haven’t been many places to hide during this year’s stock market correction (bear market?). And one of the last hiding places could be in trouble: Energy stocks. And more specifically, the Oil and Gas Exploration Sector ETF (XOP) and the Oil Services ETF (OIH)....
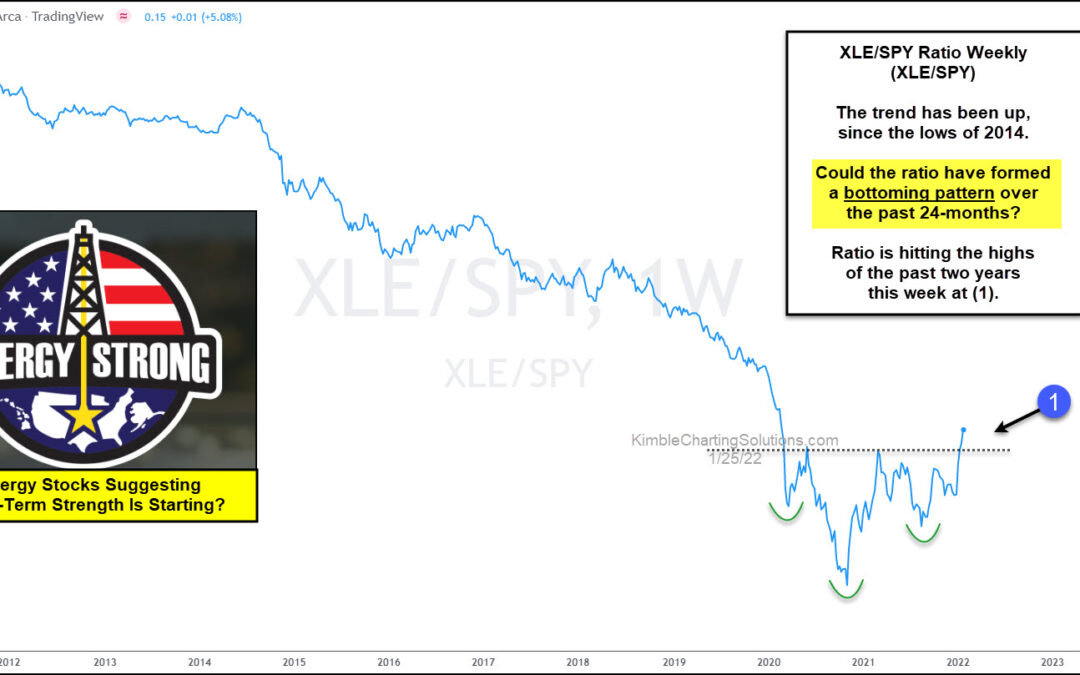
by Chris Kimble | Jan 26, 2022 | Kimble Charting
Energy stocks spent the decade of 2010 to 2020 mired in weakness… but is that trend coming to an end? The past two years have seen the Energy Sector (XLE) surge as Crude Oil has rallied back over $80. Today’s chart is a long-term “weekly” ratio chart of the Energy...
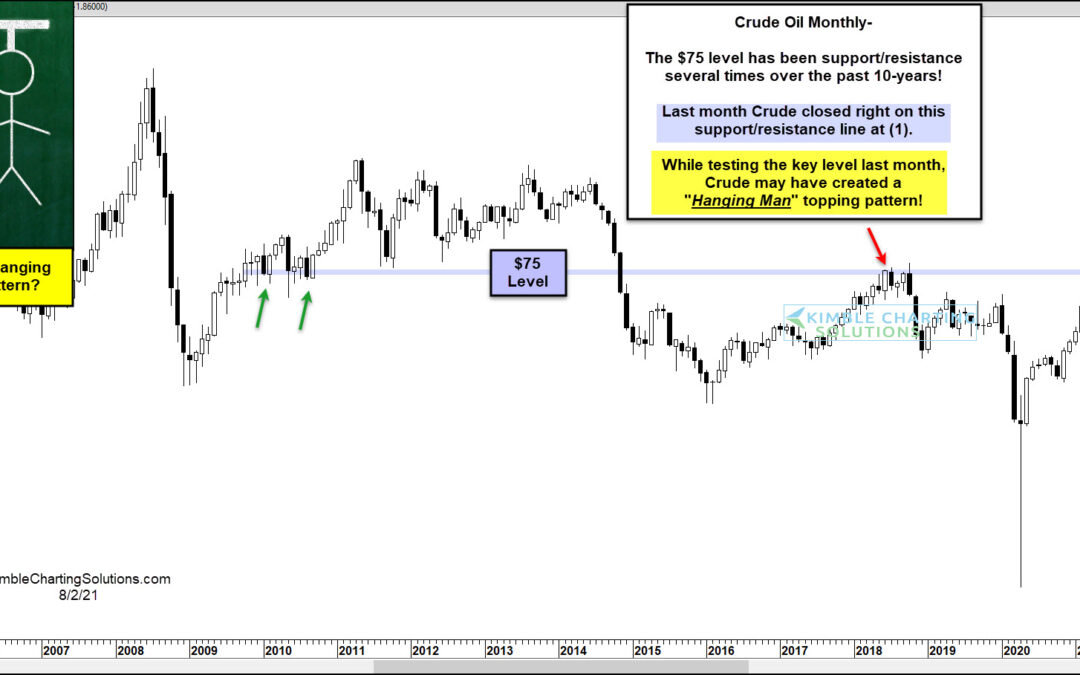
by Chris Kimble | Aug 4, 2021 | Kimble Charting
Several commodities have been on a tear higher over the past 18 months. This list of commodities includes crude oil. As a key economic input, crude oil is more than just a tradable asset. Crude oil is an excellent indicator for the economy as well as a commodity to...
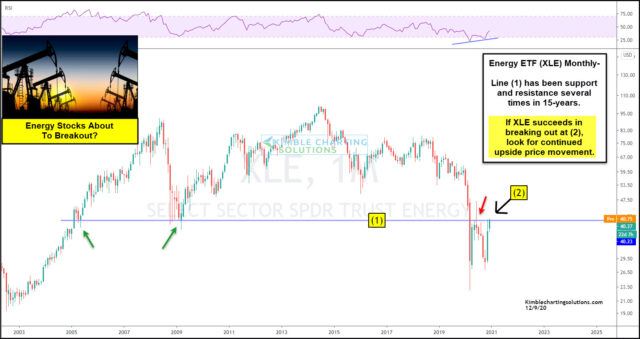
by Chris Kimble | Dec 10, 2020 | Kimble Charting
The energy sector is showing signs of life again? Should investors trust this move? We’ll let the price action speak for itself, but it investors should get a signal soon. Today’s chart take a long-term “monthly” view of the Energy Sector ETF (XLE) and highlights the...
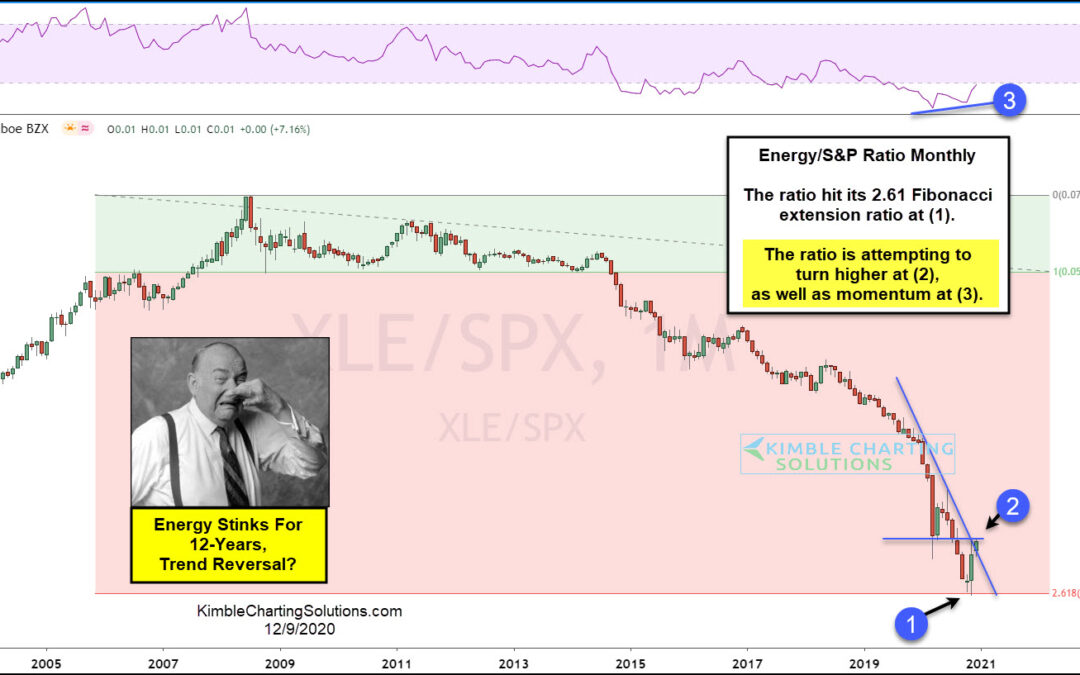
by Chris Kimble | Dec 9, 2020 | Kimble Charting
When it comes to sectors that have stunk it up over the past decade, Energy ETF (XLE) wins the award! This chart looks at the Energy ETF (XLE)/ S&P 500 ratio on a monthly basis over the past 17-years. The ratio has been creating lower highs and lower lows since...
