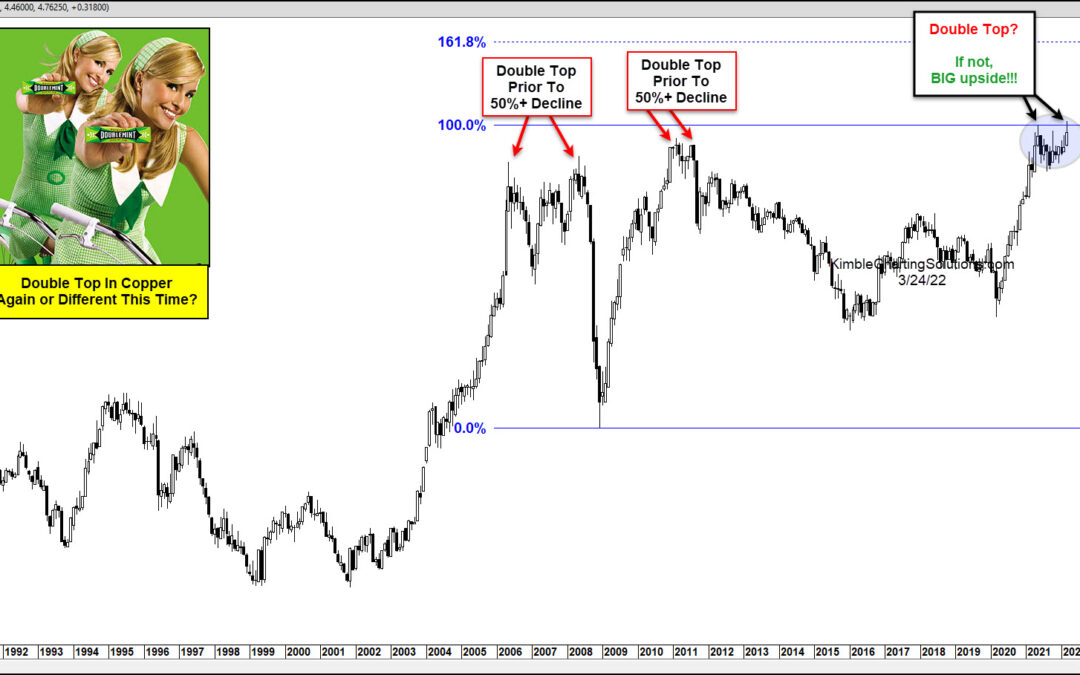
by Chris Kimble | Mar 25, 2022 | Kimble Charting
Copper is among several commodities with elevated prices right now. It has also formed an important price pattern that may send one of the strongest macro messages in years. Today, we look at a long-term “monthly” chart of Copper. As you can see, in the months/years...
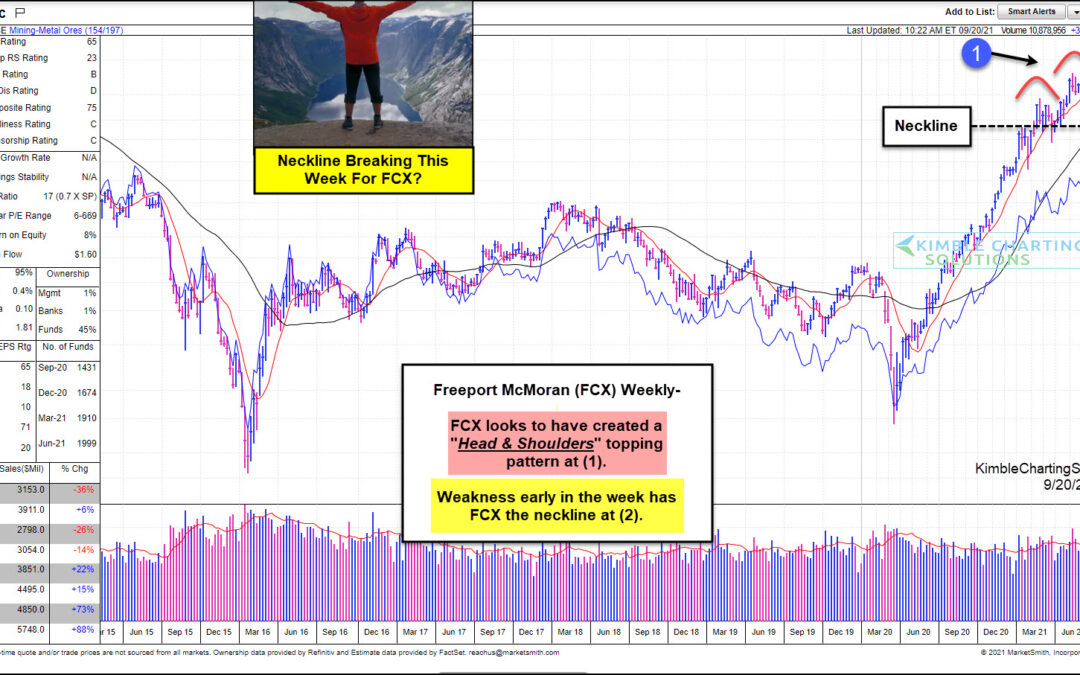
by Chris Kimble | Sep 22, 2021 | Kimble Charting
Copper and Gold miner Freeport McMoRan (FCX) is in the middle of all things metals. And the economy. As the economy heats up, copper prices tend to follow. And if interest rates and / or inflation ticks higher, Gold tends to follow. Over the past 18 months, Freeport...
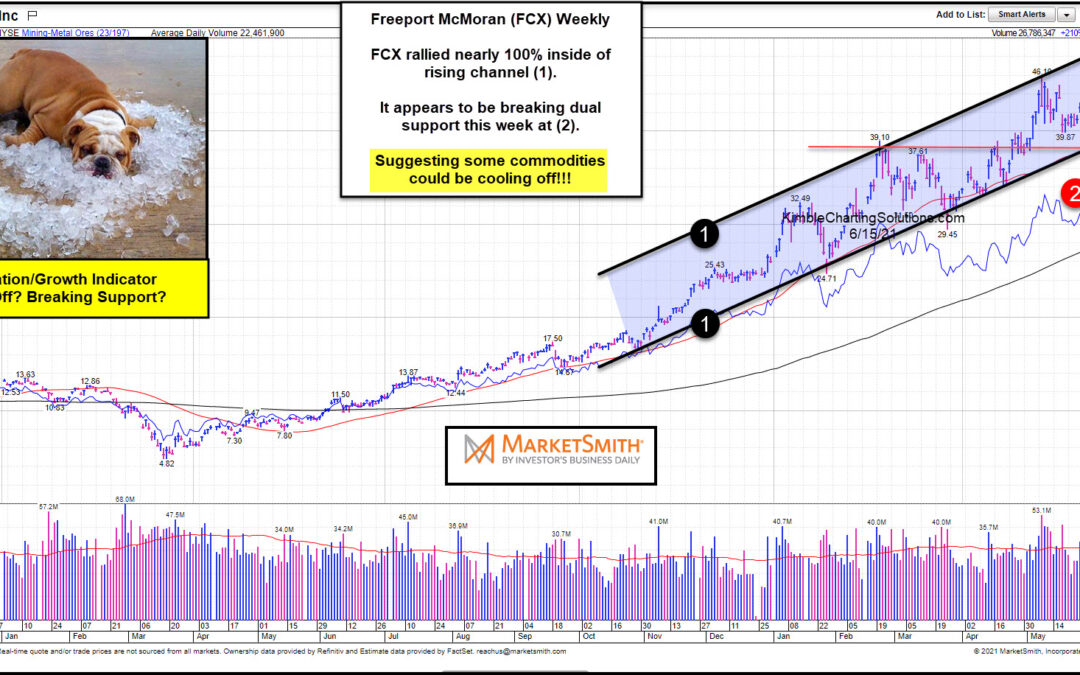
by Chris Kimble | Jun 16, 2021 | Kimble Charting
The Federal Reserve is meeting this week and the talk of the town is inflation. Will they raise interest rates to combat rising prices? One of the focuses of rising prices is commodities? Soft commodities, hard commodities, energy, food, you name it has been up over...
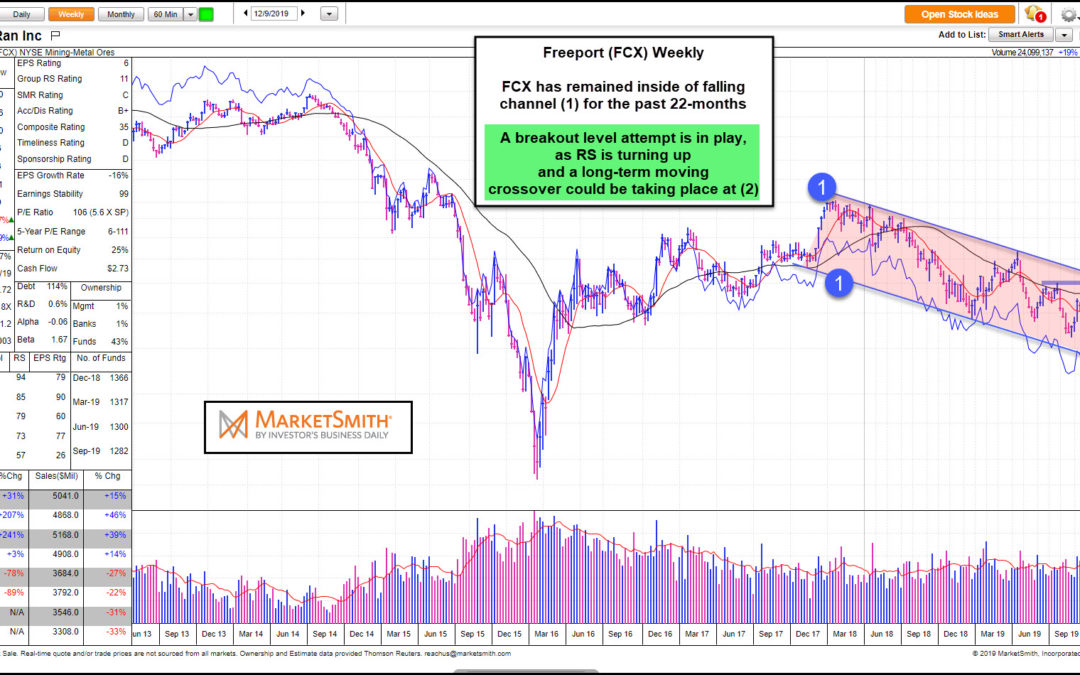
by Chris Kimble | Dec 11, 2019 | Kimble Charting
Mining company Freeport McMoRan NYSE: FCX is enjoying the tailwind from a strong year for gold and silver prices. And although Copper prices are down, Copper has been turning up lately. This has helped Freeport’s stock price recover in 2019 and has FCX testing a key...

by Chris Kimble | Dec 5, 2017 | Kimble Charting
Ole Doc Copper has performed very well over the past 2-years, as it has rallied 50%. Maybe the rally has been sent a positive message about the worlds macro picture? Could have and maybe stocks liked it. Below look at the price action of Doc Copper over the past...

by Chris Kimble | Nov 1, 2017 | Kimble Charting
Doc Copper and Gold have both done well this year. Doc Copper has been the stronger of the two, reflected in the chart below- CLICK ON CHART TO ENLARGE The strength in Doc Copper has the Gold/Copper ratio below doing something it hasn’t done in a long time!...

by Chris Kimble | Oct 16, 2017 | Kimble Charting
Doc Copper has struggled over the past 6-years, as it has created a series of lower highs since 2011. Below looks at a chart of Doc Copper over the past decade. CLICK ON CHART TO ENLARGE Doc Copper has created a series of lower highs inside of falling channel (1)...

by Chris Kimble | Aug 30, 2017 | Kimble Charting
The Power of the Pattern has shared several times on this blog, that a bullish pattern had formed in Ole Doc Copper. With the bullish pattern in play, we shared with our members and on the blog that Freeport McMoran looked to be a good asset to own a couple of months...
