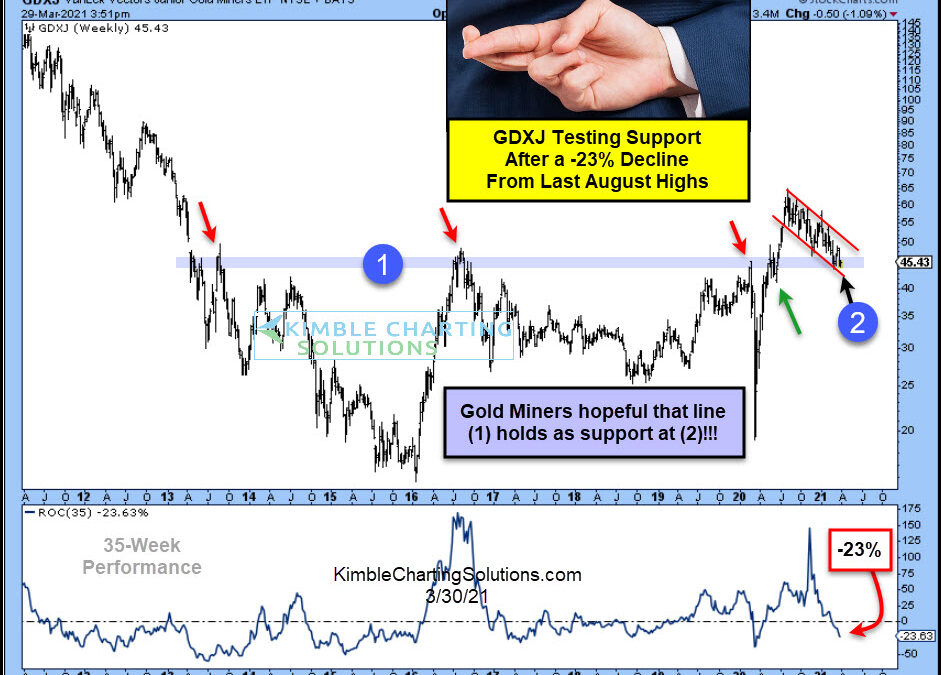
by Chris Kimble | Mar 30, 2021 | Kimble Charting
Gold mining stocks have struggled since last August, as they have lost nearly 25% in price, putting them into the bear market territory. Is this enough of a decline? Gold miners have their fingers crossed this critical support holds right now! The chart looks at...

by Chris Kimble | Mar 22, 2021 | Kimble Charting
Is Gold about to receive a very important bull/bear signal this month? Looks like it! This chart takes a peek at the Gold/U.S. Dollar ratio over the past 15-years. The ratio double topped at (1) and once it broke support in 2013, it declined sharply over the next...
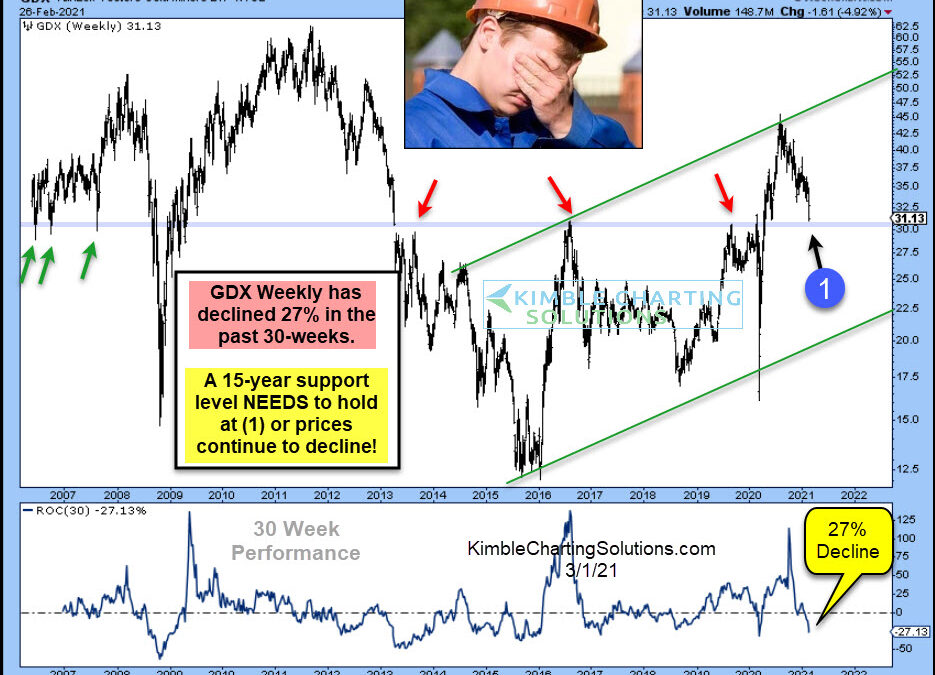
by Chris Kimble | Mar 1, 2021 | Kimble Charting
The past 8-months have been great for the broad markets, the same cannot be said for Gold Miners. Gold Miners ETF (GDX) has lost nearly a third of its value since peaking last August. This decline has taken place inside a bullish rising channel, that started at the...
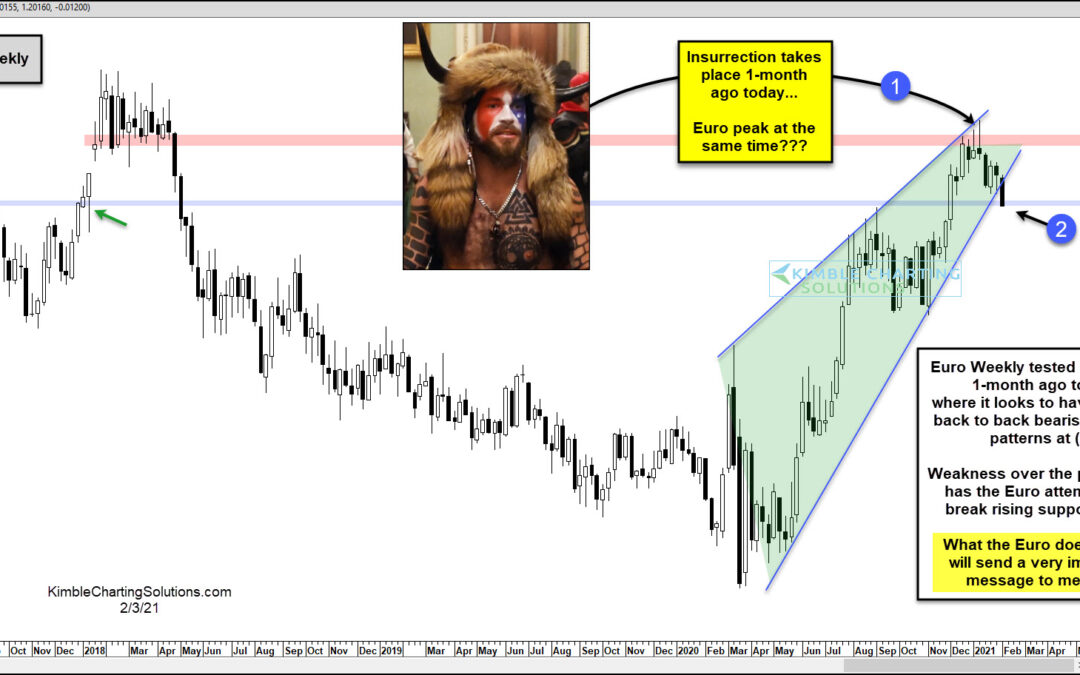
by Chris Kimble | Feb 3, 2021 | Kimble Charting
An important price point looks to have taken place at (1), on Wednesday, January the 6th, which was the day of the insurrection on the U.S. Captial! What the Euro does next looks to be very important for a variety of assets. The Euro started moving higher...
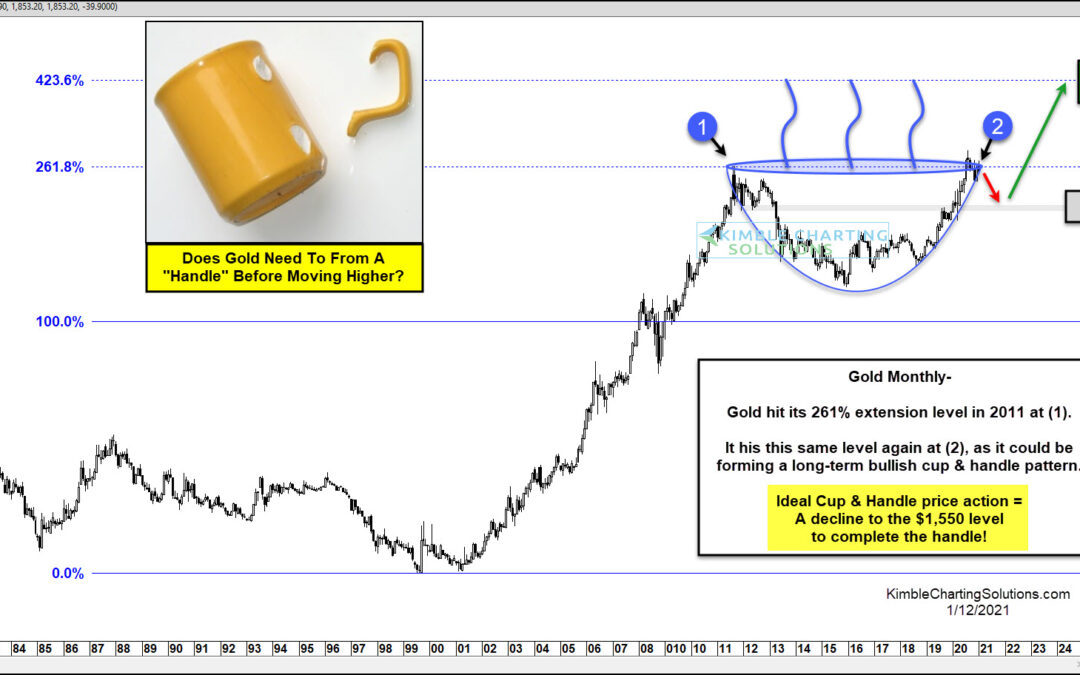
by Chris Kimble | Jan 12, 2021 | Kimble Charting
In the spring of 2020, I highlighted the potential for a very bullish long-term pattern for Gold. That pattern was the popular “cup with handle” formation. At that time, it was still attempting to fill out the right side of the “cup” formation. Today, we take another...
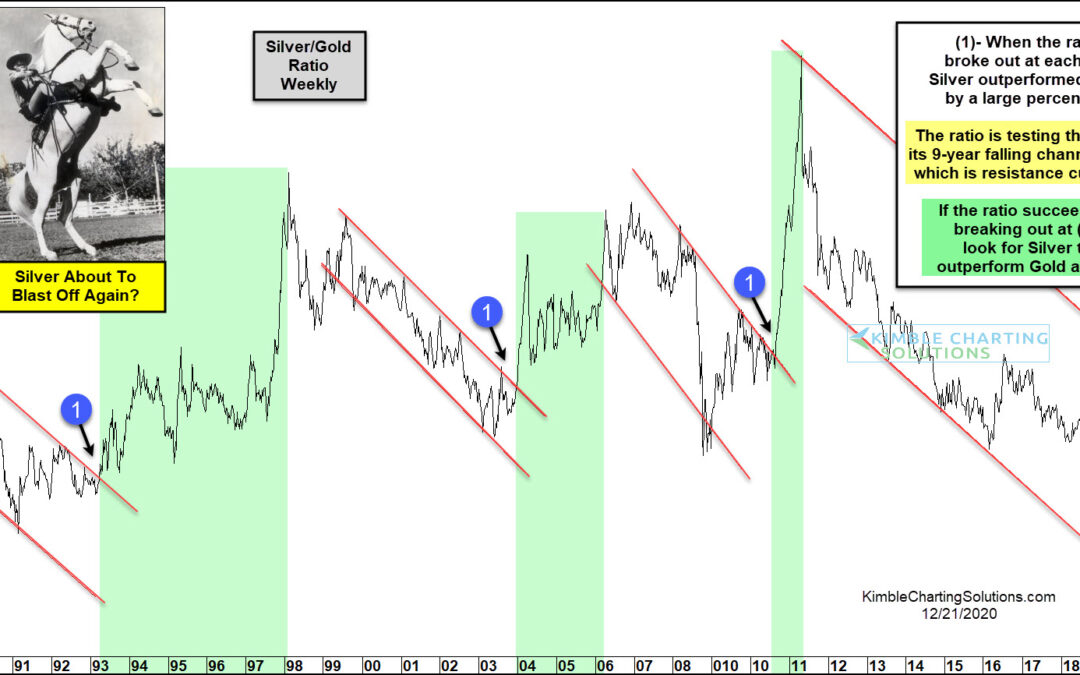
by Chris Kimble | Dec 21, 2020 | Kimble Charting
Precious metals are having a strong year in 2020. So is it any surprise that Silver has been leading Gold higher? As I’ve said before, Silver is to precious metals what small-cap stocks are to the broad market… it’s always beneficial when they lead In today’s chart...
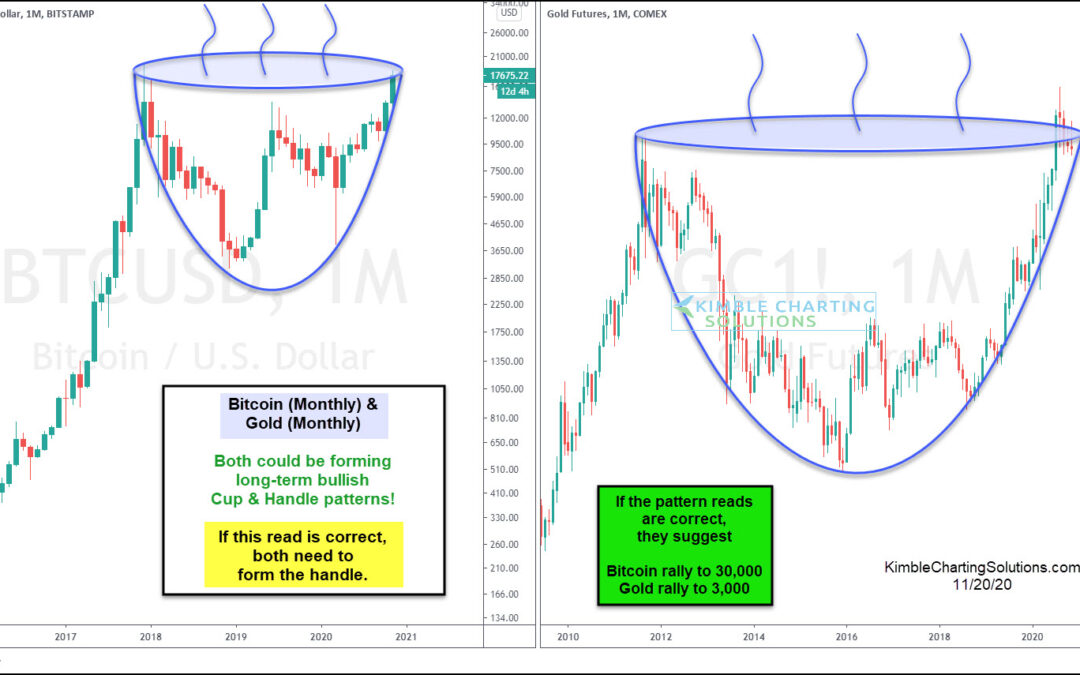
by Chris Kimble | Nov 20, 2020 | Kimble Charting
It wasn’t long ago that Bitcoin was pretty much left for dead. And a couple of years before that, Gold was in the same position. Both Bitcoin and Gold suffered severe bear markets that saw many investors jump ship. Often times, that is the only way for a durable...
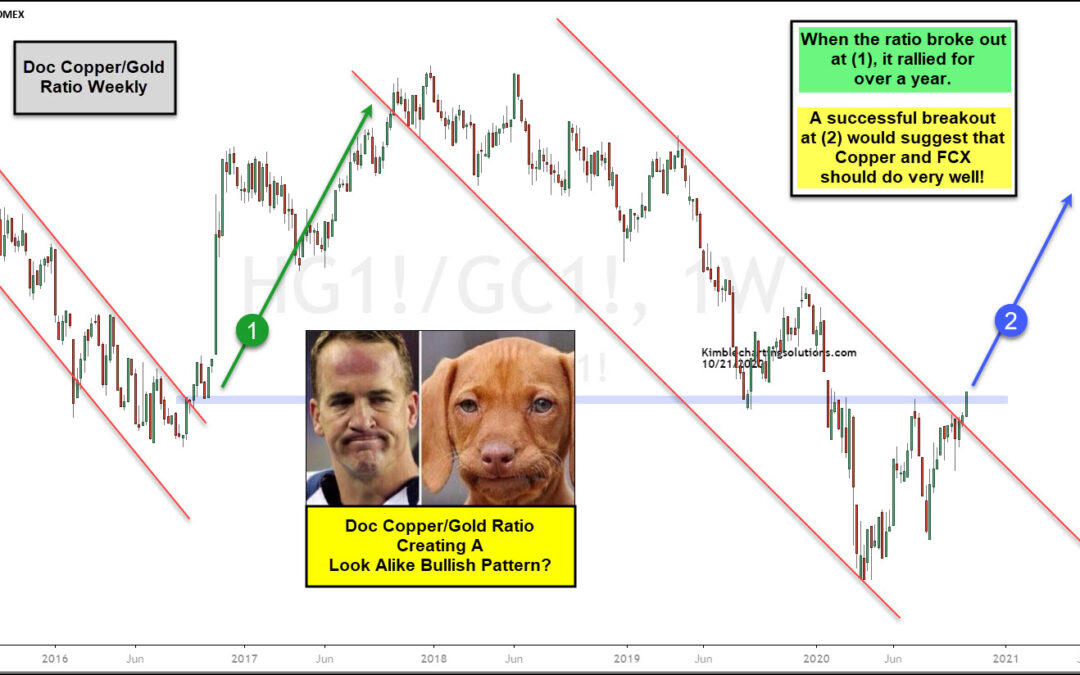
by Chris Kimble | Oct 21, 2020 | Kimble Charting
The Doc Copper/Gold ratio broke above a 2-year falling channel back in 2016 at (1). Following this breakout, it rallied for the next year. During that year, Copper related assets did very well! The ratio peaked in the summer of 2018 and created a series of lower highs...
