by Chris Kimble | Jul 24, 2018 | Kimble Charting
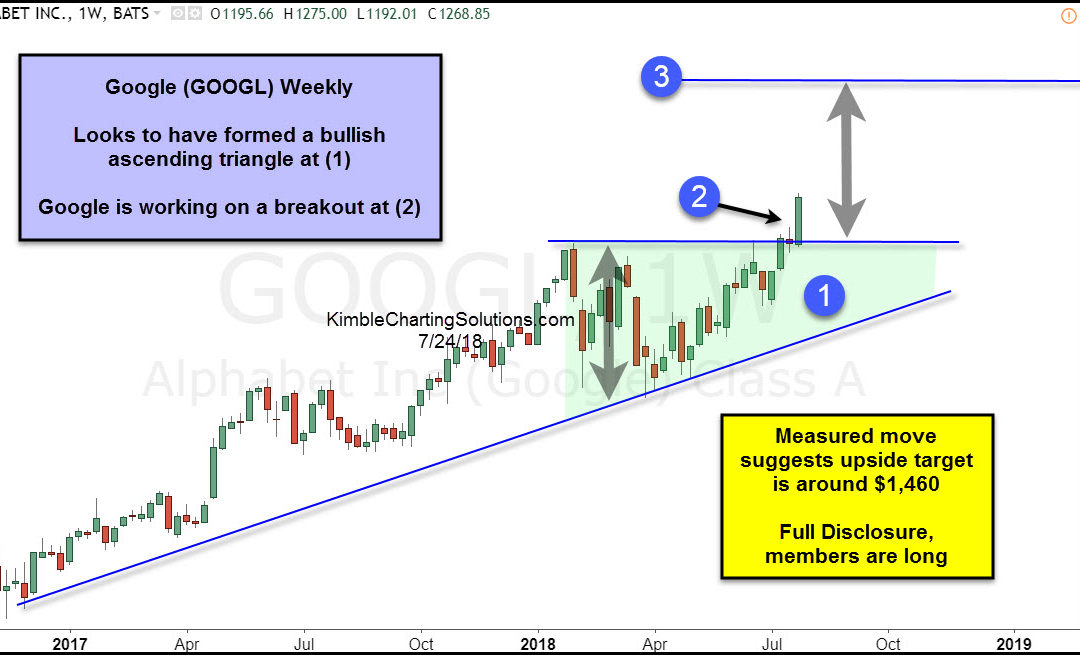
CLICK ON CHART TO ENLARGE Google over the past few months looks to be forming a bullish ascending triangle. Two-thirds of the time, this pattern leads to an upside breakout. One can use the ascending triangles to project upside targets, called measured moves. The...
by Chris Kimble | Mar 6, 2018 | Kimble Charting
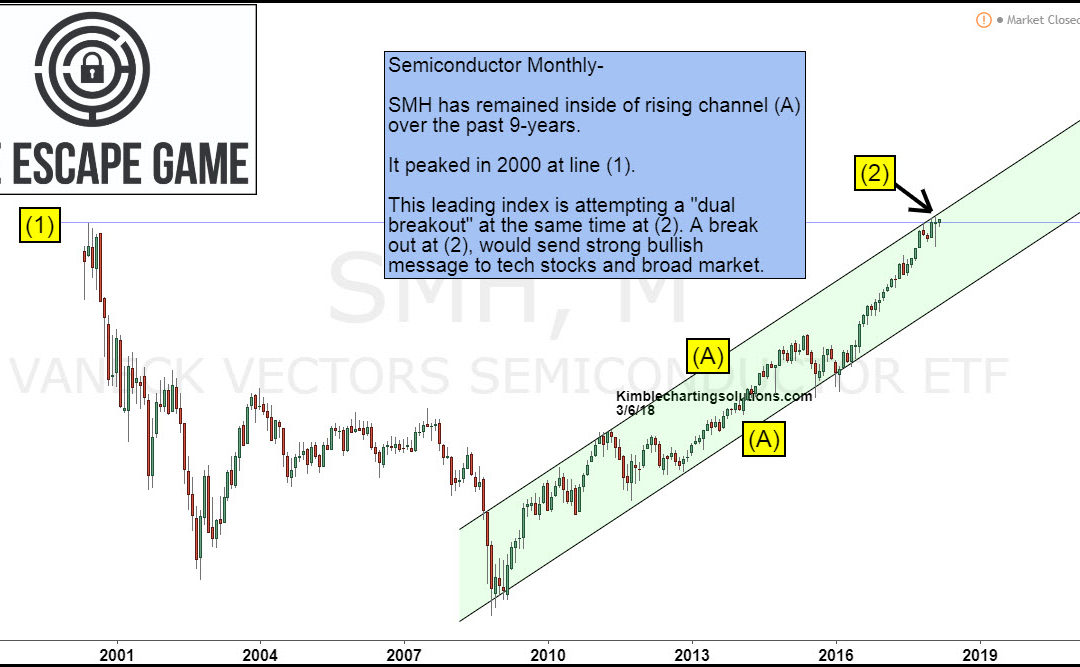
Since the 2009 lows, would you rather have owned Semiconductors (SMH) or the S&P 500? Since the 2009 lows, Semiconductors are up 550%, more than double the returns of the S&P. This very strong index is now making an attempt to “Escape” from where...
by Chris Kimble | Feb 28, 2018 | Kimble Charting
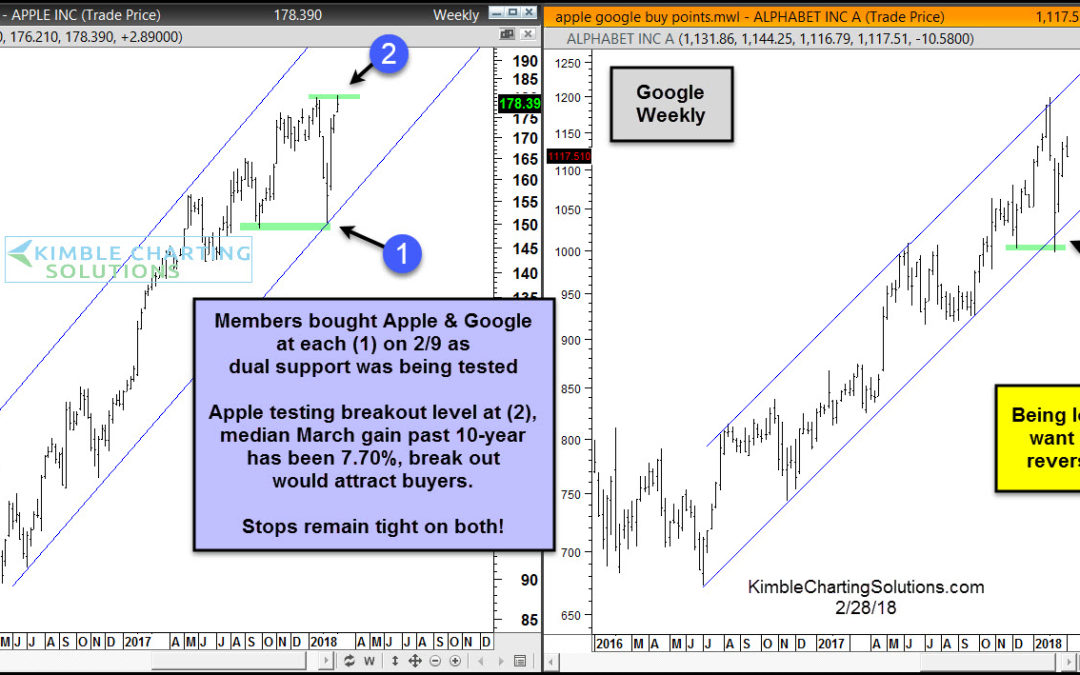
CLICK ON CHART TO ENLARGE Wanted to update viewers on the patterns Apple & Google are making. As mentioned above, members purchased both on Friday, February the 2nd, as dual support was being tested at each (1). Both have rallied nicely and reflected a good deal...
by Chris Kimble | Feb 20, 2018 | Kimble Charting
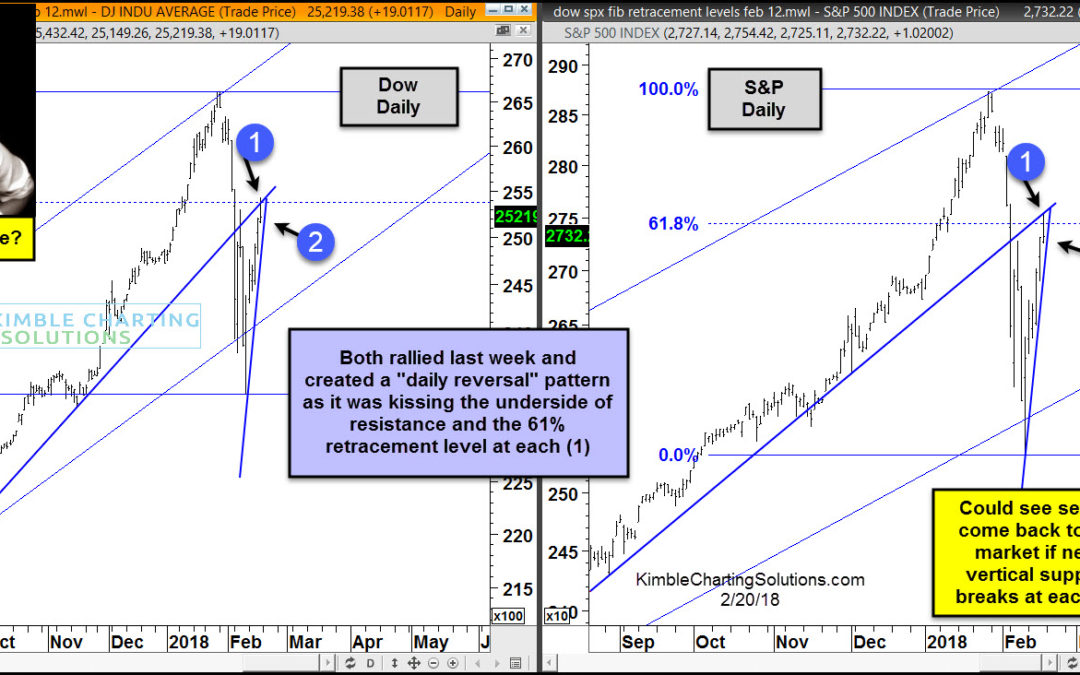
CLICK ON CHART TO ENLARGE The 2-pack above highlights that the Dow and S&P 500 remain inside of rising channels as the recent declines hit the bottom of the channels and bullish reversals took place. Short-term positive action by these key indices sent a positive...
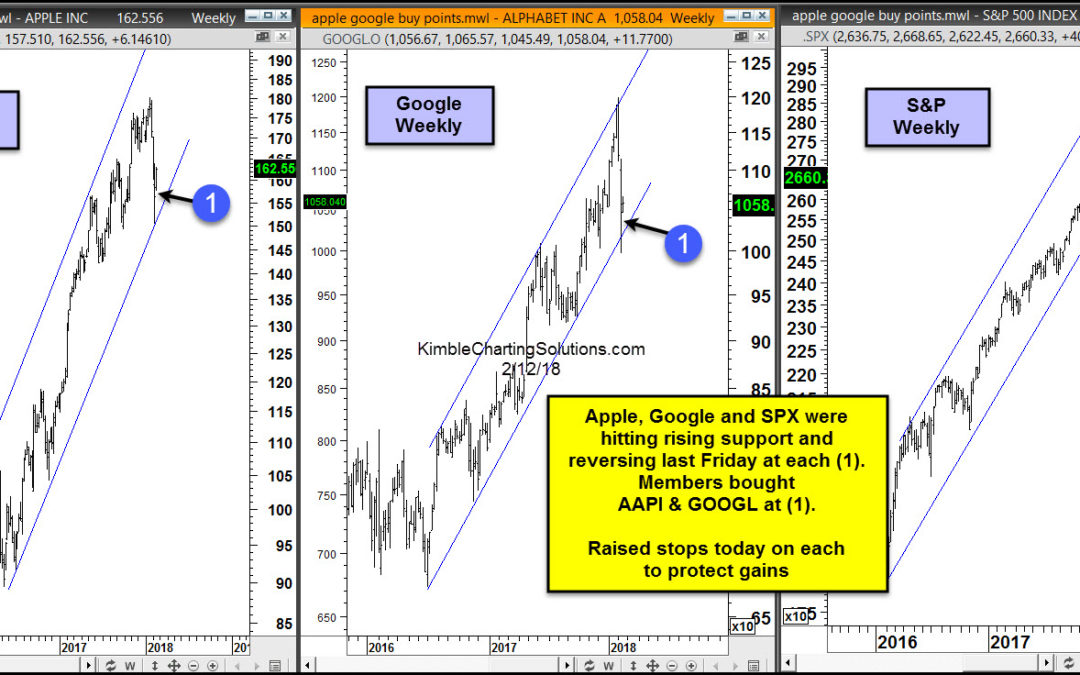
by Chris Kimble | Feb 12, 2018 | Kimble Charting
The Power of the Pattern keeps members updated on the FAANG stocks each week. As markets were falling hard last week, a couple of the FAANG stocks looked to be presenting an opportunity for members. Below looks at two of those stocks and why they were purchased- CLICK...
