by Chris Kimble | Feb 15, 2018 | Kimble Charting
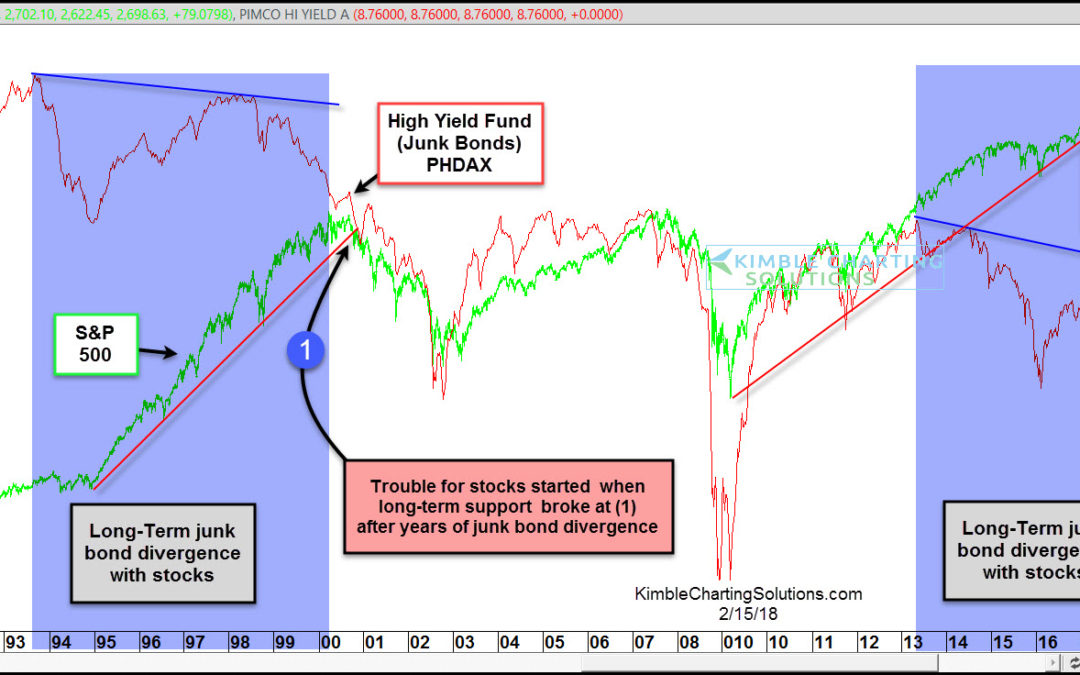
Some times Junk bonds can give quality hints to the next short & long-term move in stocks. Junk bonds look to be sending both of those signals again. The next two charts share long and short-term perspectives and opportunities in the junk space. Below compares...

by Chris Kimble | Feb 13, 2018 | Kimble Charting
Some of our Financial Planning/RIA customers ask us to send them long-term moving averages on a weekly basis, because it helps them make long-term asset allocation decisions. This 6-pack was created to give perspective on a diverse set of assets. It includes...
by Chris Kimble | May 25, 2017 | Kimble Charting
So Goes Junk, So Goes Stocks? Most of the time this is true. Stocks historically want to see Junk moving higher, not diverging against them. Below looks at Junk Bond ETF JNK over the past few years. CLICK ON CHART TO ENLARGE JNK started heading lower back in 2014,...

by Chris Kimble | Mar 14, 2017 | Kimble Charting
This past week the bull market in stocks, celebrated its 8-year anniversary, off the March 2009 lows. The bull trends off the lows in 2009 are still solidly in play, as key indices remain inside of long-term rising channels. Make no mistake the series of higher lows...
