by Chris Kimble | Aug 6, 2021 | Kimble Charting
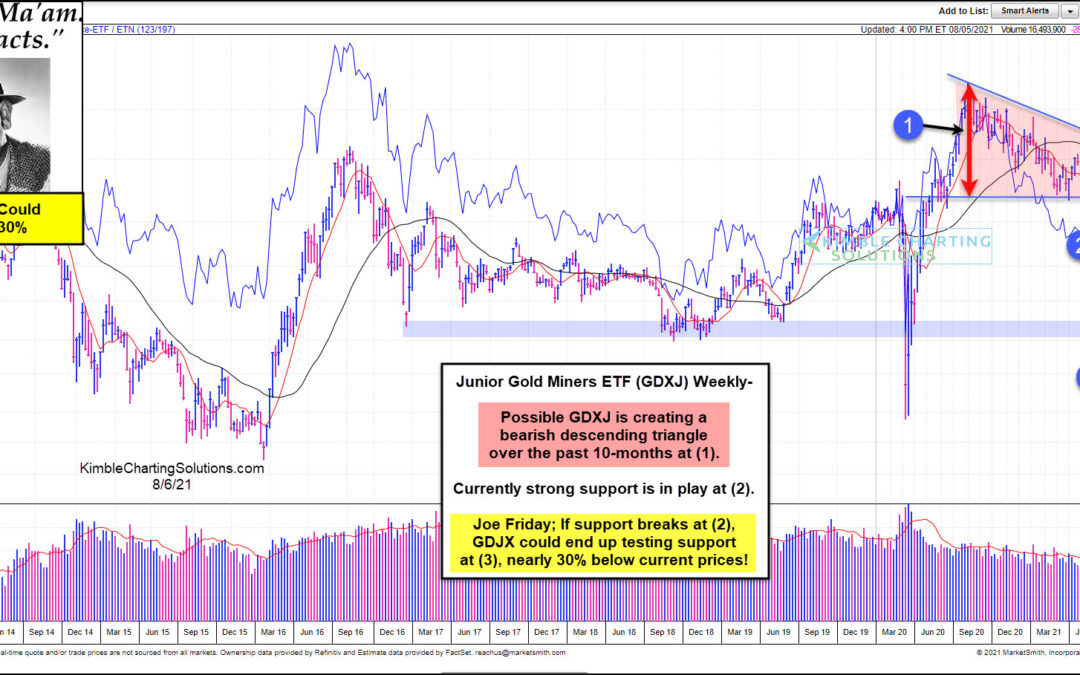
This chart comes from Marketsmith.com, which looks at Junior Gold Miners ETF (GDXJ). This chart highlights that GDXJ could be creating a bearish descending triangle over the past 10-months at (1). Currently, GDXJ is testing an important support line at (2). Joe Friday...
by Chris Kimble | Mar 19, 2021 | Kimble Charting
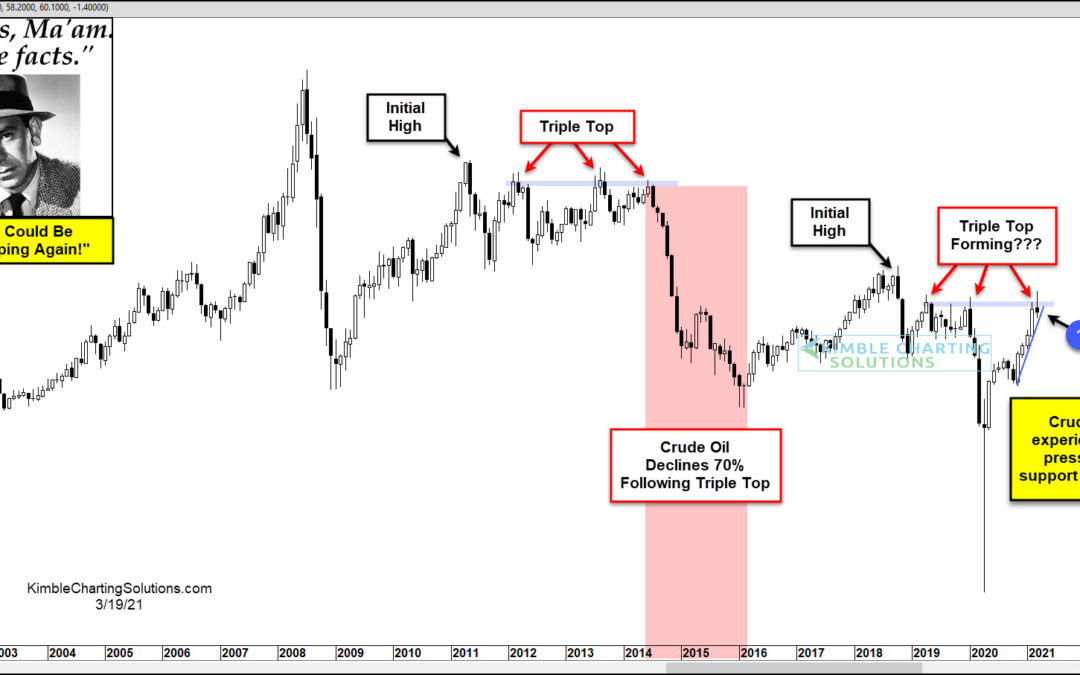
Is the stage set for Crude Oil to experience a decline of at least 50%? Possible This chart looks at Crude Oil on a monthly basis over the past 20-years. Crude oil created a Triple top over a 2-year period (2012 -2014), then selling pressure drove it down nearly 70%...
by Chris Kimble | Jan 29, 2021 | Kimble Charting
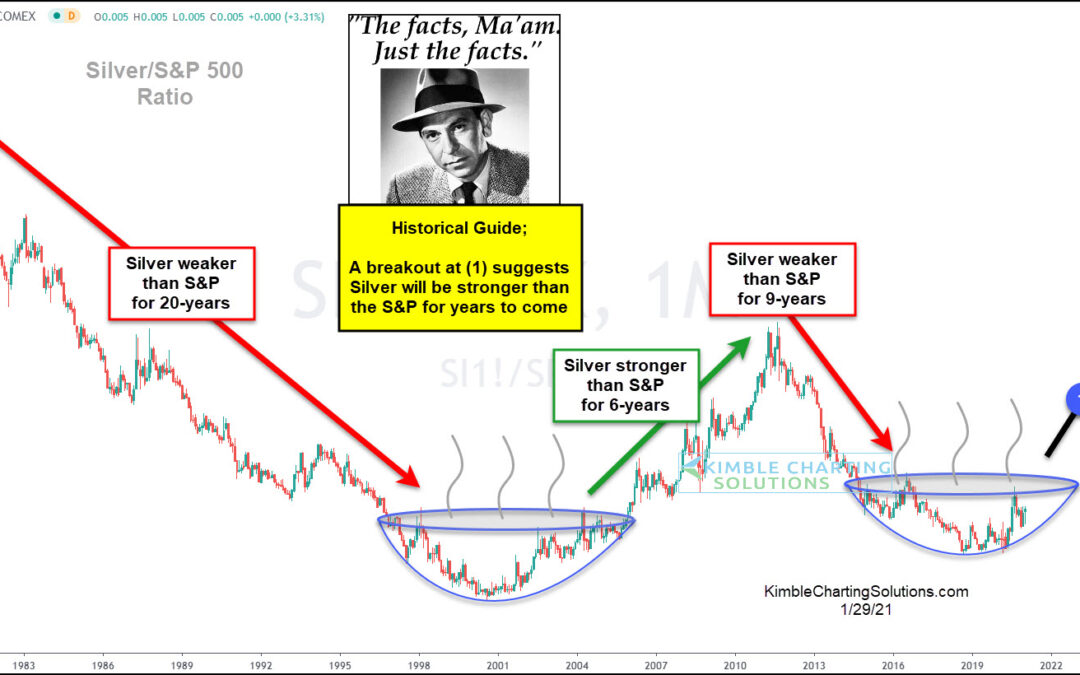
Is Silver about to outperform the S&P for years to come? This pattern suggests it sure could. This chart looks at the Silver/S&P 500 ratio over the past 40-years, highlighting several long-term trends. Silver was weaker than the S&P 500 from 1980 until...
by Chris Kimble | Jan 22, 2021 | Kimble Charting
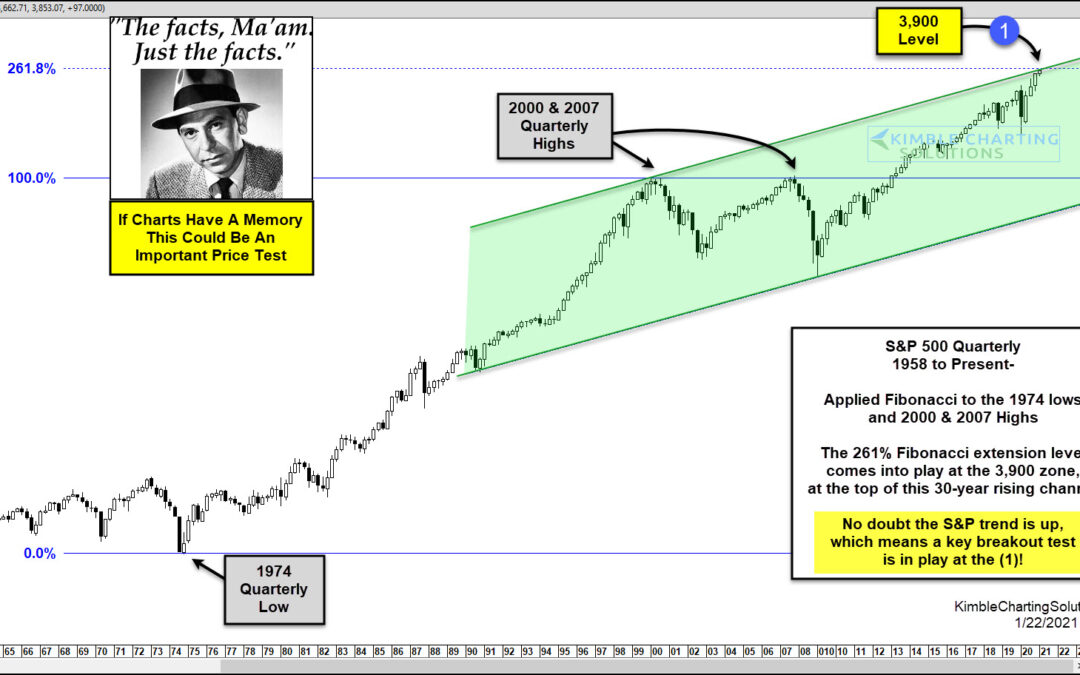
Do charts have memories? Can prices as far back as 45-years ago impact prices today? I understand if you answered both questions with a resounding no. In my humble opinion, an important test of these questions comes into play at current prices in the S&P 500 at...
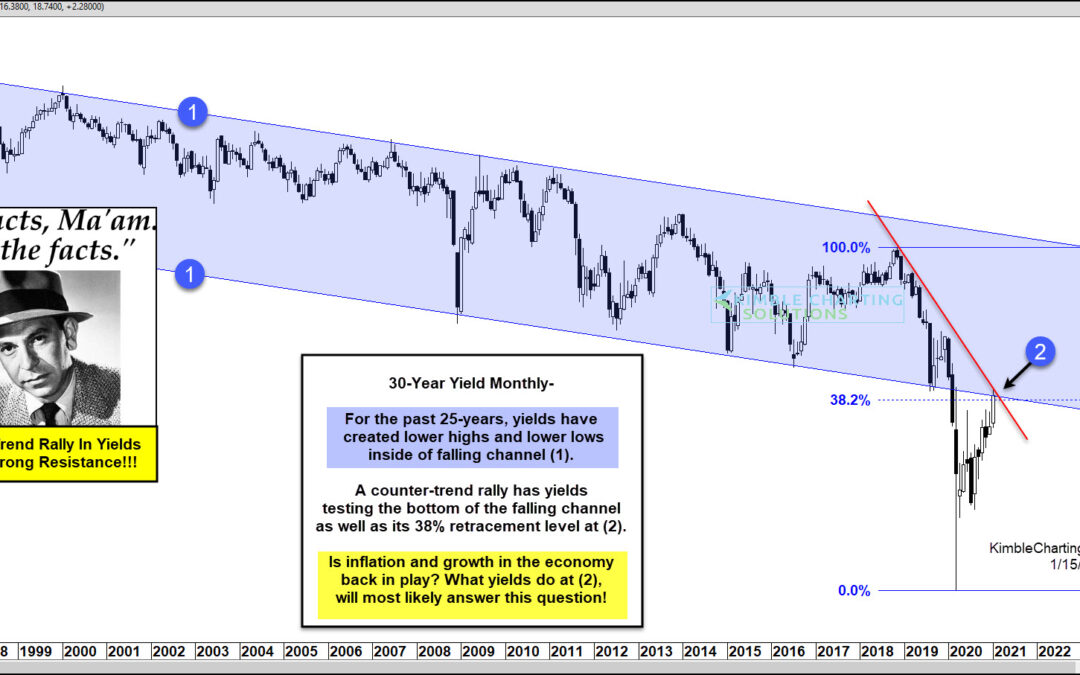
by Chris Kimble | Jan 15, 2021 | Kimble Charting
Treasury bond yields (and interest rates) have been falling for so long now that investors have taken it for granted. But bond yields have been rising for the past several months and perhaps investors should pay attention, especially as we grapple with questions about...
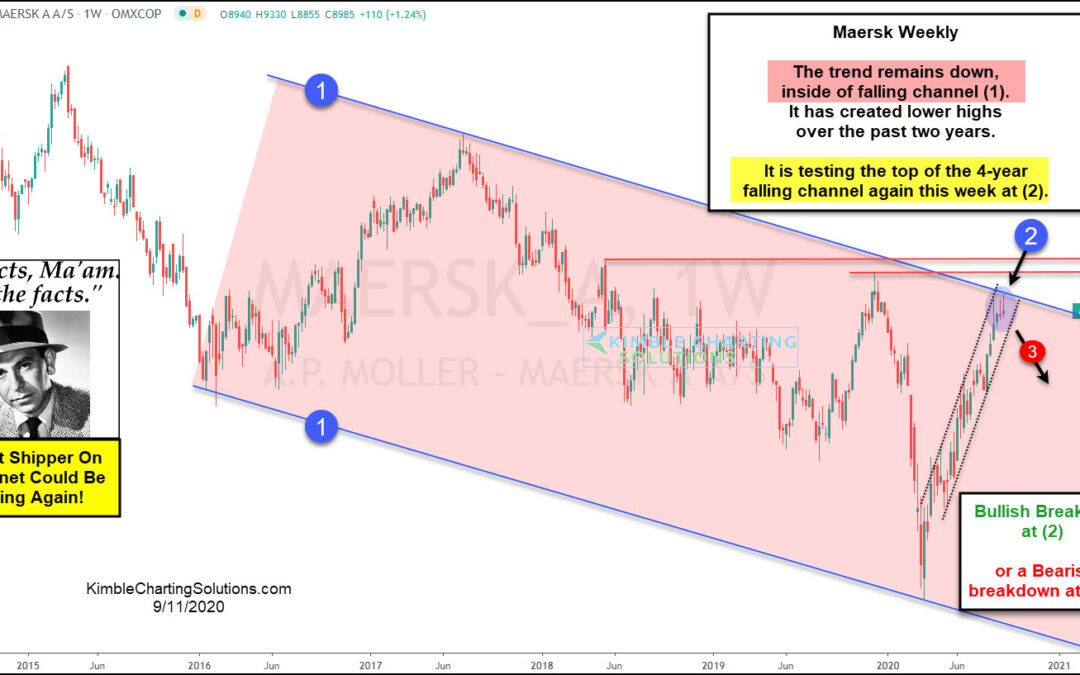
by Chris Kimble | Sep 11, 2020 | Kimble Charting
Is the largest shipper on the planet about to send an important price message to the world? Joe Friday says yes! The chart looks at Maersk, which is the largest shipper on the planet. Over the past 4-years, it has created falling channel (1), a series of lower highs...
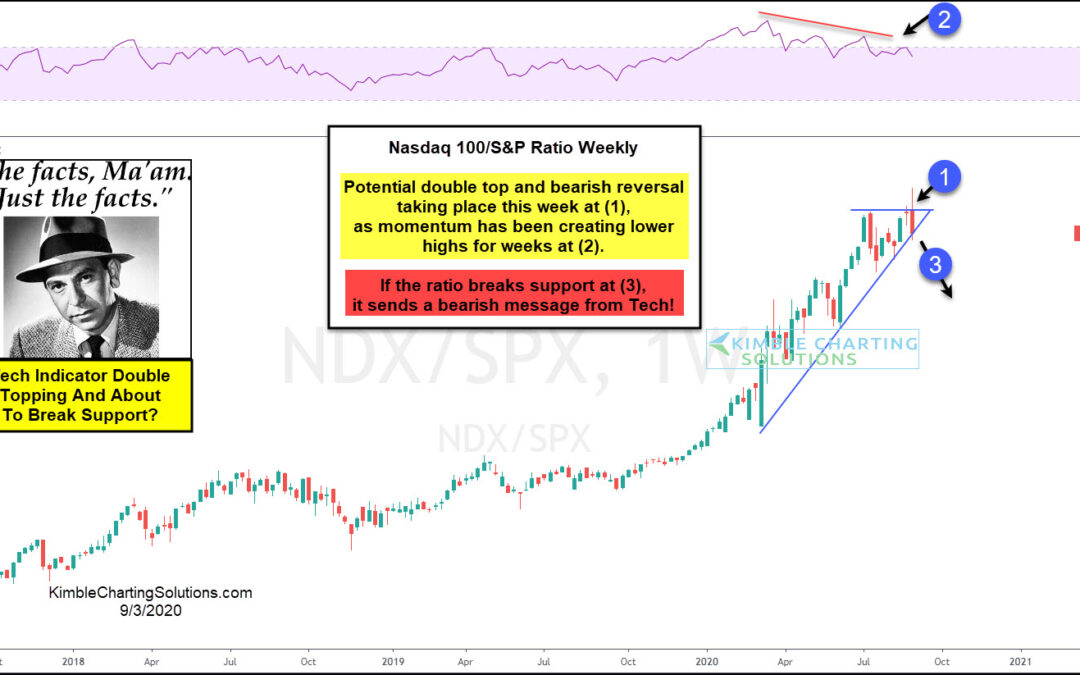
by Chris Kimble | Sep 4, 2020 | Kimble Charting
Is an important Tech stock indicator double topping and about to send the first bearish message in months? Joe Friday suggests it is possible! This chart looks at the Nasdaq 100/S&P ratio on a weekly basis. The trend has been strongly higher for months, reflecting...
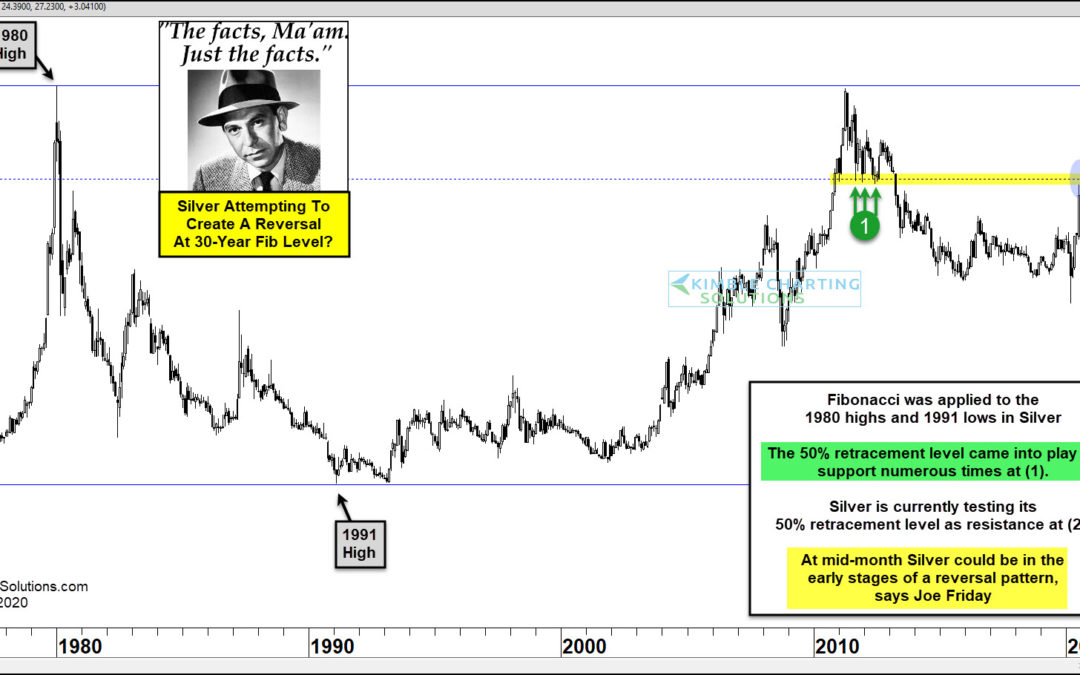
by Chris Kimble | Aug 14, 2020 | Kimble Charting
Could Silver prices from 30-years ago be influencing price action this month? Joe Friday suggests it is possible. This chart looks at Silver Futures on a monthly basis over the past 40-years. Fibonacci levels were applied to the 1980 highs ($50) and 1991 lows ($.350)...
