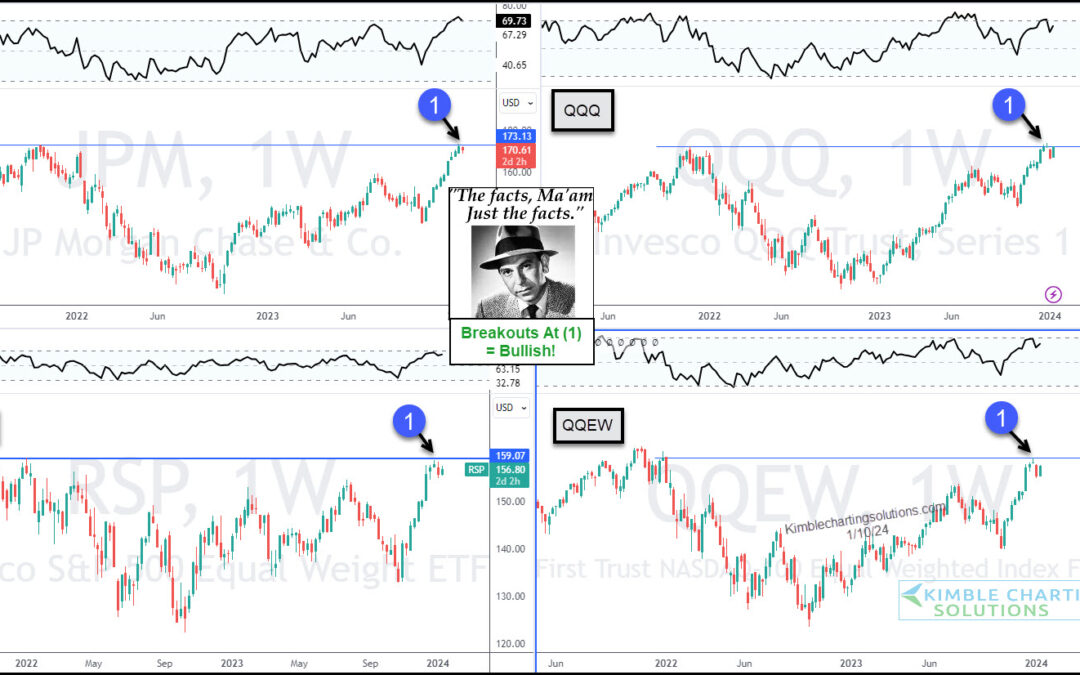
by Chris Kimble | Jan 12, 2024 | Kimble Charting
After a big year-end rally, the stock market attempts to consolidate gains in January. That consolidation has several stock indices and ETFs trading near recent price highs. “The facts, Ma’am. Just the facts.” – Joe Friday Today’s chart 4-Pack highlights a key bank...
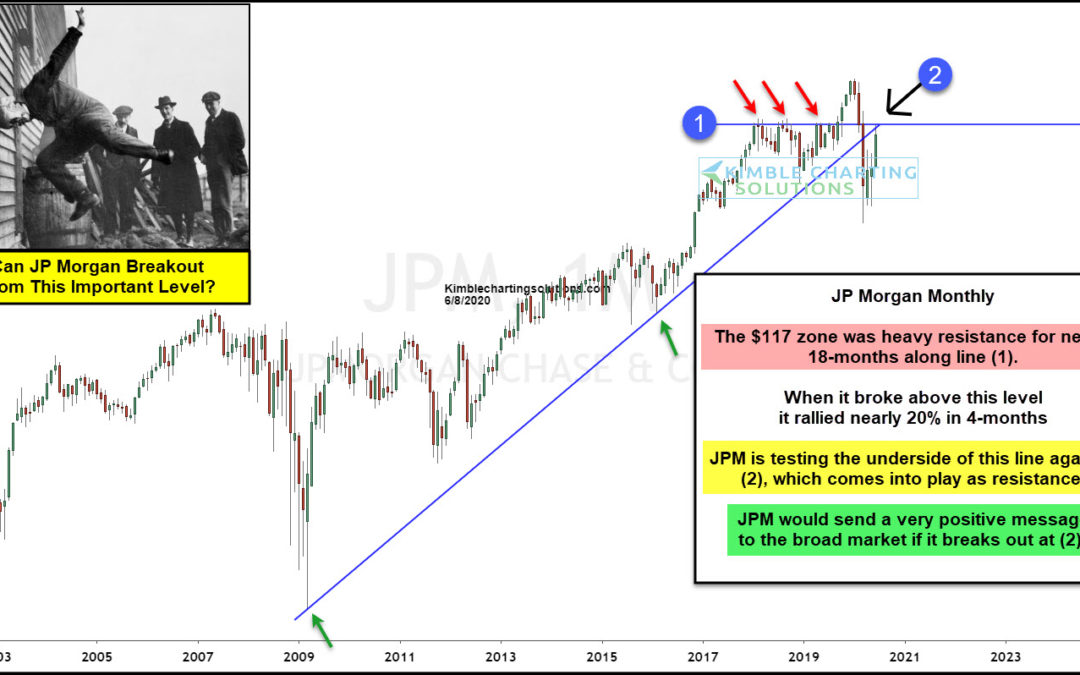
by Chris Kimble | Jun 8, 2020 | Kimble Charting
Is a major bank in the states about to send the broad market a bullish message? If it breaks out at (2), it will! JP Morgan struggled to break above resistance for nearly 18-months, as it keep kissing the underside of line (1). Once it succeeded in breaking out, it...
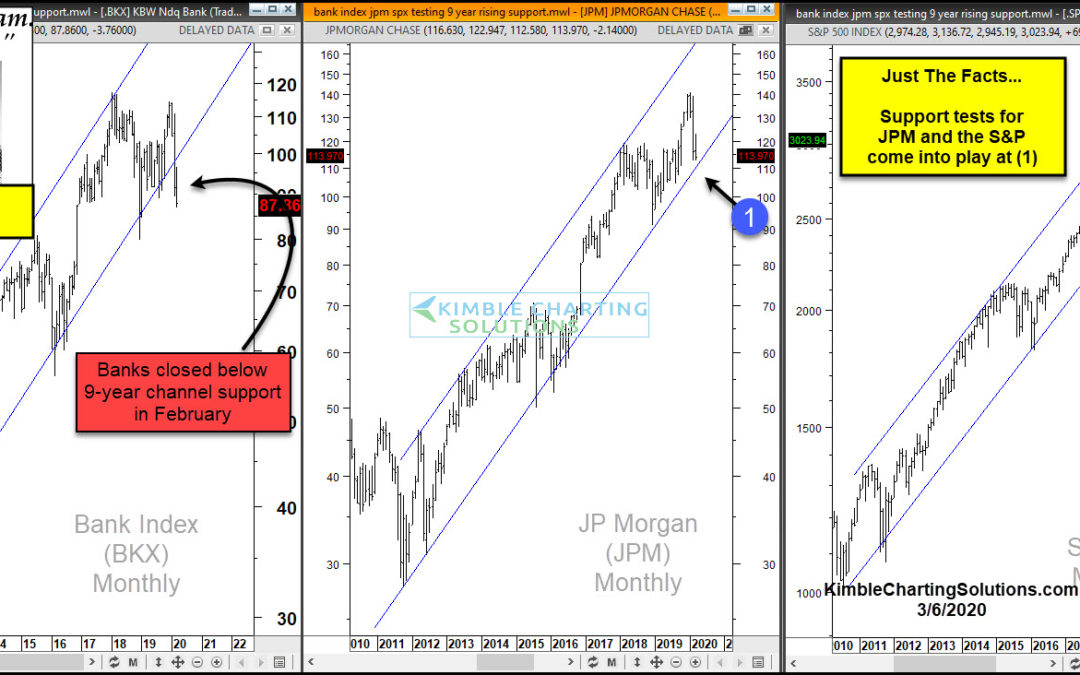
by Chris Kimble | Mar 6, 2020 | Kimble Charting
By now you are most likely aware that the S&P 500 just experienced its quickest 10% decline in its history. Did this decline break long-term rising channels? Check out the 3-pack above. This 3-pack takes a monthly look at the Bank Index (BKX), JP Morgan (JPM) and...
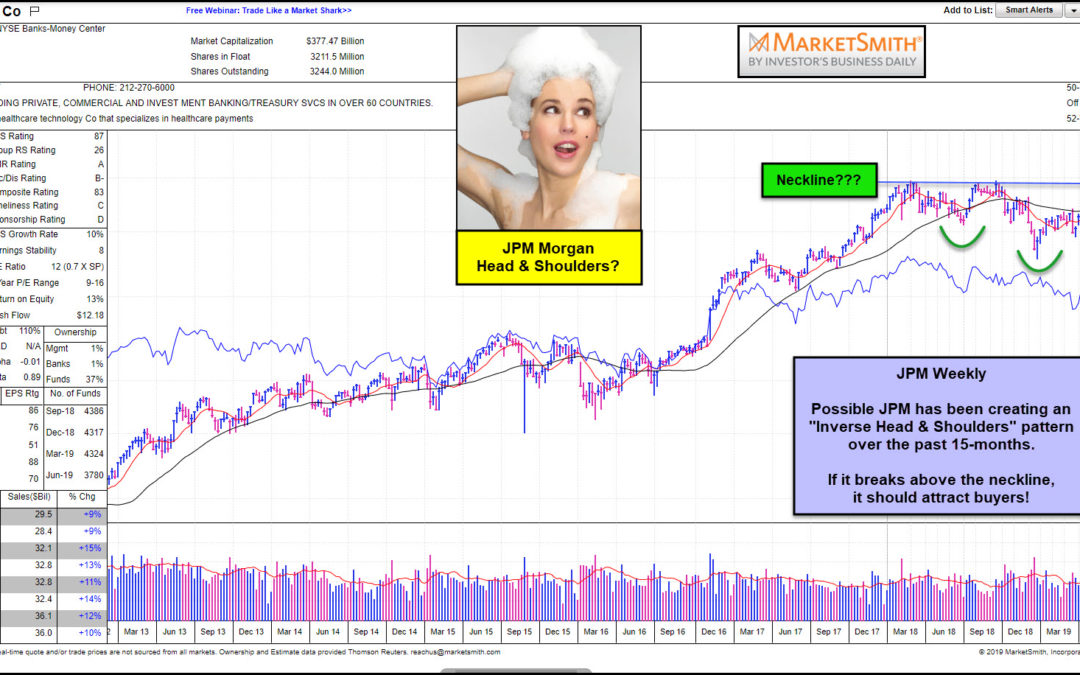
by Chris Kimble | Jul 24, 2019 | Kimble Charting
Is JP Morgan creating a pattern which is suggesting much higher prices? It could be! This chart looks at JP Morgan (JPM) on a weekly basis over the past 5-years. The chart itself comes from MarketSmith, a service provided by Investors Business Daily. Over the past...
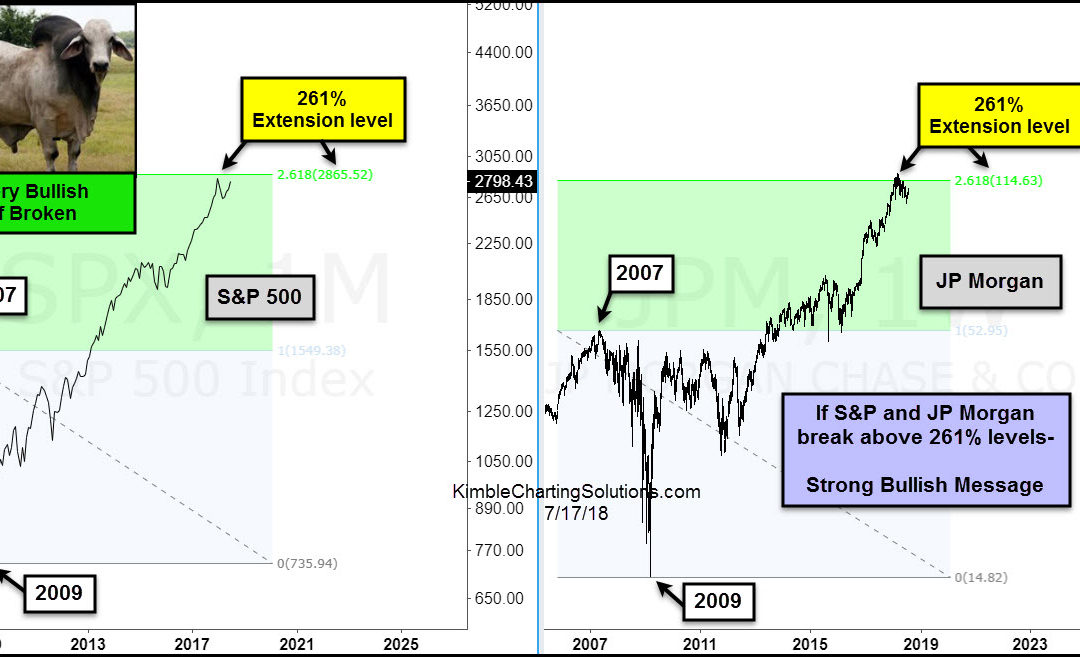
by Chris Kimble | Jul 17, 2018 | Kimble Charting
CLICK ON CHART TO ENLARGE The long-term trends for the S&P 500 and JP Morgan remain up. Despite the trends being up, both have made little upward progress over the past 6-months? Any reason why they have struggled to move higher? One technical reason could be a...

by Chris Kimble | Apr 6, 2018 | Kimble Charting
CLICK ON CHART TO ENLARGE This chart looks at the Bank Index over the past 17-years on a monthly basis. The index has remained inside of a bullish rising channel (A) since the lows in 2011. The rally over the past 7-years took it to the top of this channel and back to...
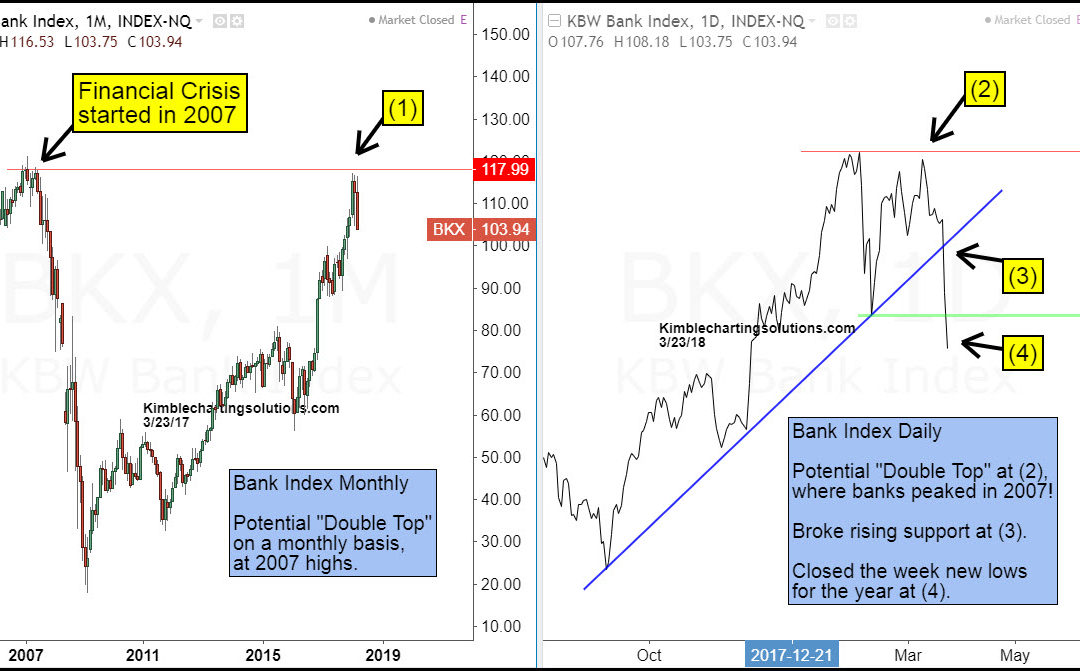
by Chris Kimble | Mar 24, 2018 | Kimble Charting
CLICK ON CHART TO ENLARGE The 2-pack above looks at the KBW Bank Index on a long and short-term basis. The chart on the left looks at the index on a monthly basis over the past 12-years. The rally over the past couple of years brought banks back to where they peaked...
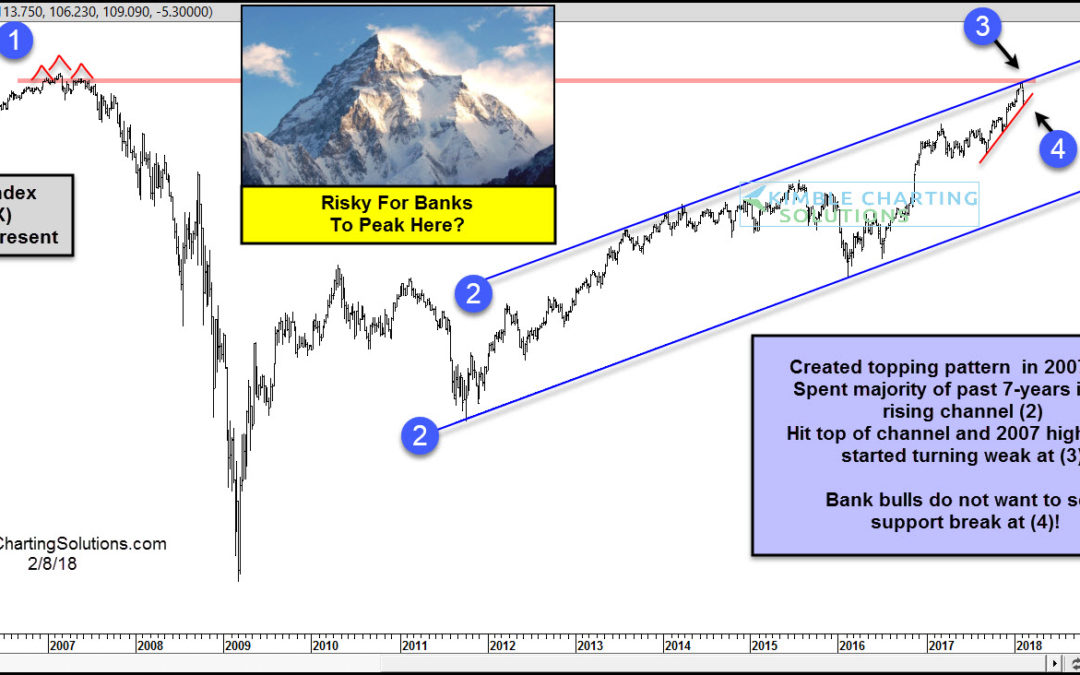
by Chris Kimble | Feb 8, 2018 | Kimble Charting
CLICK ON CHART TO ENLARGE The chart above looks at the Bank Index over the past 13-years. In 2007 at (1), the index created a topping pattern, prior to the financial crisis and its 80% decline over the next couple of years. The rally in banks over the past 7-years...
