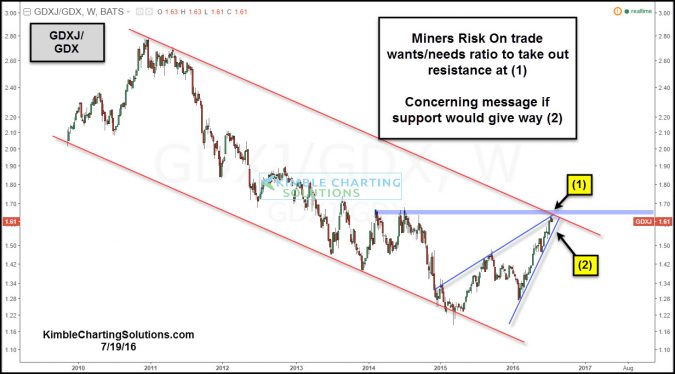
by Chris Kimble | Jul 19, 2016 | Kimble Charting
CLICK ON CHART TO ENLARGE The chart above compares GDXJ (Junior Mining stocks to Senior Mining Stocks). The ratio has been in a down trend for the past 5-years and it is making an attempt to break this trend. A breakout above dual resistance at (1), would suggest the...

by Chris Kimble | May 18, 2015 | Kimble Charting, Metals
CLICK ON CHART TO ENLARGE When it comes to buy and holding senior gold mining stocks (GDX), they have been a place to avoid for the past few years. The same is even more true of Junior Mining stocks (GDXJ), as its performance has even been worse over the past few...
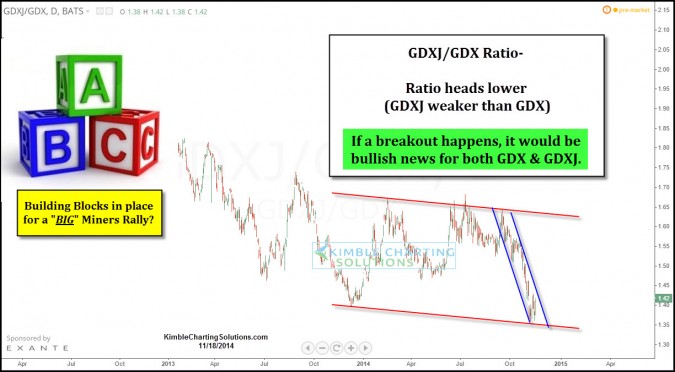
by Chris Kimble | Nov 18, 2014 | Kimble Charting
CLICK ON CHART TO ENLARGE The building block to a decent rally in the hard hit miners complex could start with this taking place! The above chart reflects the Junior Miners ETF (GDXJ) to Senior miners ETF (GDX). When this ratio is heading south, GDJX is weaker...

by Chris Kimble | Nov 11, 2014 | Kimble Charting
CLICK ON CHART TO ENLARGE Gold Miners ETF GDX broke below the lows of almost a year ago (Dec 2013) and promptly lost nearly 20% of its value in less than two weeks. This decline took it down to its Fibonacci 161% extension level (based upon the lows of a year...

by Chris Kimble | Jul 22, 2014 | Kimble Charting
CLICK ON CHART TO ENLARGE The above chart compares the New York Stock Exchange Index (NYSE) to the Junior Miners ETF (GDXJ). The ratio has created a strong move up over the past few years, as the stock market has performed tons better than the miners ETF. The...

by Chris Kimble | Jul 9, 2014 | Kimble Charting
CLICK ON CHART TO ENLARGE A major shift in the Gold Bugs/SPY ratio could be taking place! The Gold Bugs/SPY ratio has fallen on hard times as stocks have outperformed the Gold bugs index over the past few years by a wide margin, pushing this index down a...
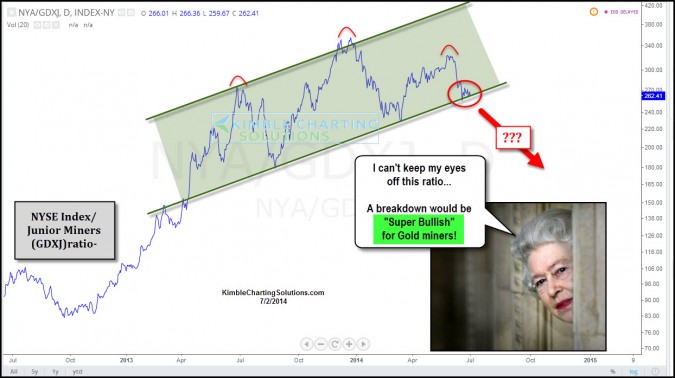
by Chris Kimble | Jul 2, 2014 | Kimble Charting
CLICK ON CHART TO ENLARGE This ratio compares the NYSE Composite Index to the Junior miners ETF (GDXJ). When the ratio is moving higher the NYSE is reflecting relative strength to the small mining stocks. Over the last year the ratio has stayed with a uniform...

by Chris Kimble | Apr 4, 2014 | Kimble Charting
CLICK ON CHART TO ENLARGE The Junior Gold mining ETF (GDXJ) finds itself at key price point right now. The ETF broke above falling resistance and it is now testing it as support, for the first time. At the same time this support test is taking place, GDXJ could...
