by Chris Kimble | Jun 1, 2013 | Kimble Charting
CLICK HERE TO WATCH INTERVIEW We discuss why we are shorting the Nikkei (EWV up 20% in 8 Days), what message Lumber and home builders is sending, Double top in the NYSE with margin debt in the danger zone, new Eiffel Tower patterns forming and break downs in Kimble...

by Chris Kimble | May 28, 2013 | Kimble Charting
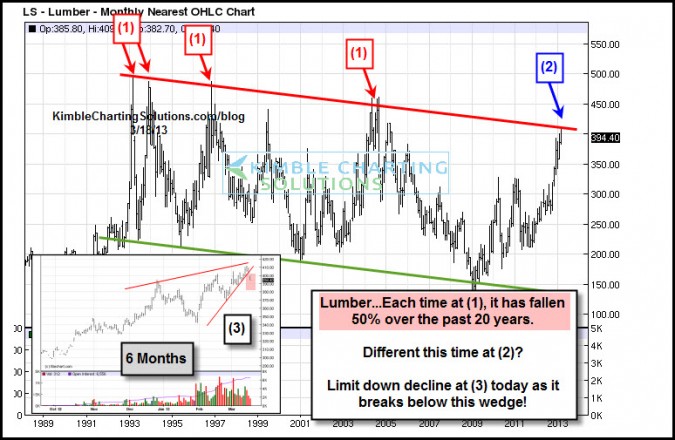
The Power of the Pattern reflected that a key economic asset could fall 50% in value back on 3/18, due to 20-year channel resistance and 75% bulls. (see post here) Lumber was trading at $385 at the time, today lumber is limit down trading at $287, losing 25% of its...

by Chris Kimble | May 15, 2013 | Kimble Charting
CLICK ON CHART TO ENLARGE Lumber has traded within a falling channel for the past 20-years. When lumber has hit the bottom of the channel, stocks have followed to the tune of 100% rallies twice. The key to this pattern is when Lumber is at the top of the channel...

by Chris Kimble | May 1, 2013 | Kimble Charting
Could falling lumber prices be sending an important signal about the future direction of the economy and stock market? Lumber prices over the past 25 years have been a quality leading indicator for the future direction of the economy and the stock market, in both...
by Chris Kimble | Mar 18, 2013 | Kimble Charting
CLICK ON CHART TO ENLARGE Lumber has traded inside of a channel for the past 20 years. Each time it has hit the bottom of the channel it has rallied 100% in price. Each time it has hit the top of the channel at (1), it ended up falling 50% in price. Lumber...
by Chris Kimble | Sep 10, 2010 | Kimble Charting
Lumber peaked in mid-April, then fell over 40% in 60 days. Some say that was due to the ending of the first time buyers home program. No matter what the reason, on a price basis, lumber is breaking from a bullish ascending triangle. For those open to trading futures...
