
by Chris Kimble | Mar 2, 2015 | Kimble Charting, Sector / Commodity
CLICK ON CHART TO ENLARGE Above are markets that are starting this month at all-time highs. Only the Nikkei is not at an all-time high, it did finish last month at a new monthly high, surpassing the highs hit in 2007. Historically, having numerous markets closing at...
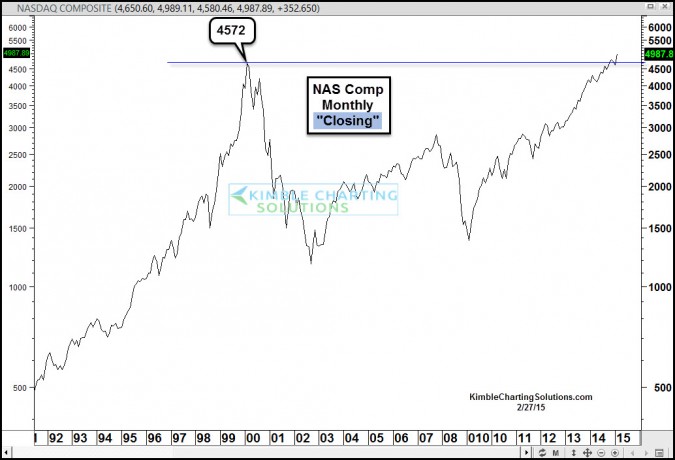
by Chris Kimble | Feb 27, 2015 | Kimble Charting
CLICK ON CHART TO ENLARGE As the month comes to a close, today a first in the Technology industry could take place. At the same time, the Nasdaq Composite and Nasdaq 100 index could both reach “all-time monthly closing highs.” This morning the Nasdaq...

by Chris Kimble | Jan 5, 2015 | Kimble Charting
CLICK ON CHART TO ENLARGE This time of year people seem compelled to make predictions for the year ahead. Making year-ahead predictions is above my pay grade, I will leave that exercise to the smart people. In the theme of looking ahead, I would like to look...
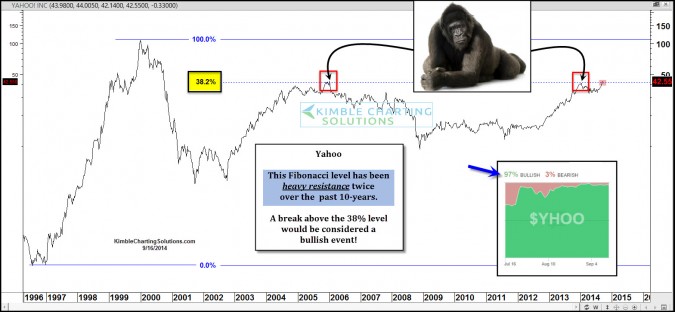
by Chris Kimble | Sep 16, 2014 | Kimble Charting
CLICK ON CHART TO ENLARGE For the past decade this 38% Fibonacci level has been very heavy resistance for Yahoo, stopping it upwards progress two different times. Could the third time be different with the assistance of Alibaba? Sentiment towards Yahoo by...

by Chris Kimble | May 30, 2014 | Kimble Charting
CLICK ON CHART TO ENLARGE The Nasdaq Composite index has found support several times along line (A) for the past 30-years. It even found this line as key support during the lows of the 2009 financial crisis. Line (B) is a parallel channel line to...
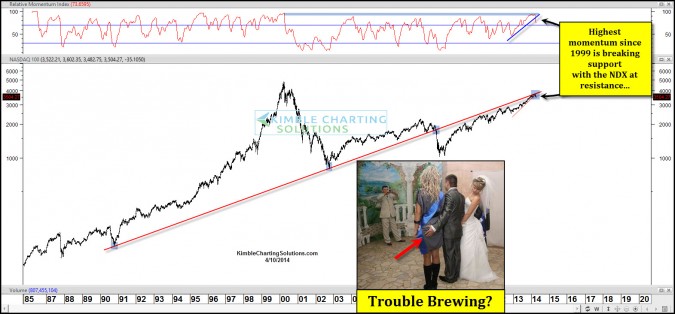
by Chris Kimble | Apr 10, 2014 | Kimble Charting
CLICK ON CHART TO ENLARGE Mo Mo stocks have been in the news, now some are calling them No-mentum stocks. Speaking of momentum, levels have been hit in the chart above, that haven’t been seen since 1999! This overbought momentum is now breaking support,...

by Chris Kimble | Apr 7, 2014 | Kimble Charting
CLICK ON CHART TO ENLARGE This 5-pack of chart focuses on key U.S. stock index’s and how each of them are facing key long-term lines at the exact same time and a couple of them are facing Fibonacci extension levels too. If one breaks out will all...

by Chris Kimble | Apr 5, 2014 | Kimble Charting
CLICK ON CHART TO ENLARGE Two weeks ago the Power of the Pattern shared that the NDX had recorded the highest overbought momentum readings since the 2000 highs. At the same time it was forming a bearish rising wedge at resistance as key Bio Tech names...
