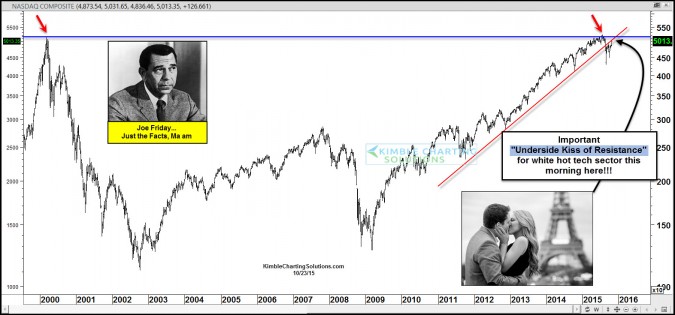
by Chris Kimble | Oct 23, 2015 | Kimble Charting
CLICK ON CHART TO ENLARGE Good earnings in tech land causing some tech companies to scream higher this morning. If one owned Google, Amazon or Microsoft at yesterdays close, they are doing well this morning. The rallies in tech land has the Nasdaq Composite index at...

by Chris Kimble | Aug 21, 2015 | Kimble Charting
CLICK ON CHART TO ENLARGE This chart looks at the Nasdaq Composite Index, dating back almost 25-years. The strong rally in this tech index off the double bottom in 2009 has been very impressive, as tech has been stronger than the broad market. The rally now has the...

by Chris Kimble | Aug 14, 2015 | Kimble Charting
Let me start off with this…At this time the trend in the tech space is up! The Nasdaq Composite Index and Nasdaq 100 are both above support lines and long-term moving averages! Leading tech indices are at prices points where weakness would not be good to see...
by Chris Kimble | Aug 4, 2015 | Kimble Charting
CLICK ON CHART TO ENLARGE The left chart looks at the Nasdaq Composite index over the past 20-years. Currently the index is back at the same price as it was back at the Dot Com highs. With the trend being up (above support and moving averages) the NAS, is attempting a...
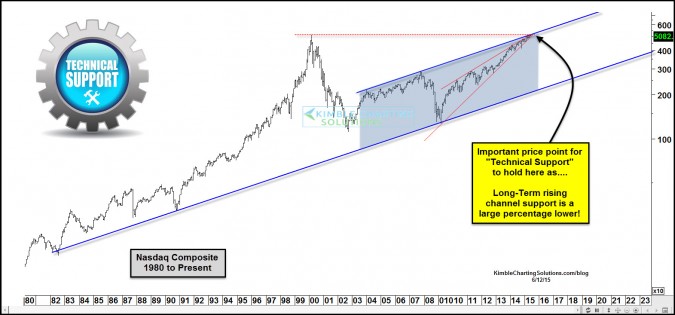
by Chris Kimble | Jun 12, 2015 | Kimble Charting
CLICK ON CHART TO ENLARGE The Nasdaq Composite index finds itself at the same price level as it was at the heights of the dot.com bubble peak. By itself one could view it as a potential resistance line in the sand. This price point has my attention though even more....
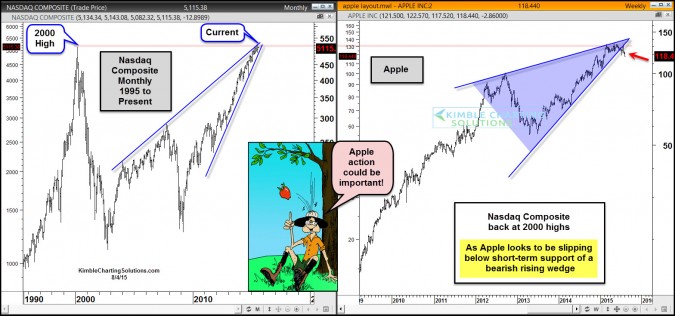
by Chris Kimble | Jun 11, 2015 | Kimble Charting
The chart below takes a look at Apple, as it could be creating a bullish reversal pattern (wick) at dual support. If this is true and should it push higher, it could help the Nasdaq Composite index avoid a double top pattern. CLICK ON CHART TO ENLARGE Apple looks to...
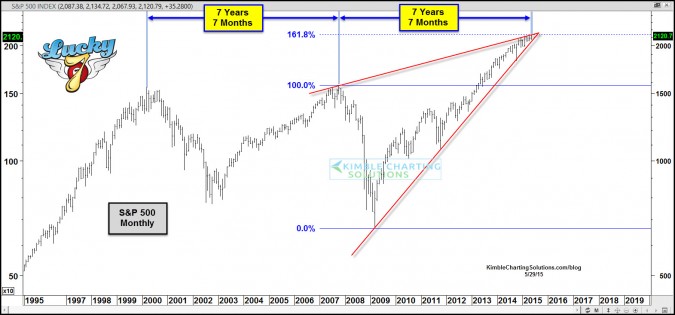
by Chris Kimble | May 29, 2015 | Kimble Charting
CLICK ON CHART TO ENLARGE Could the S&P 500 be pulling a repeat of the 2000-2007 topping process? The chart above reflects that the tops in 2000 & 2007 were 7 years and 7 months apart. Is it possible that another top is taking place 7 years and 7 months from...

by Chris Kimble | Mar 12, 2015 | Kimble Charting
CLICK ON CHART TO ENLARGE Even though the Nasdaq Composite Index just closed last month at all-time highs, Microsoft can say the same! The rally off the 2009 lows recently had MSFT hitting its 23% retracement level based upon the 2000 highs and 2009 lows. As it was...
