by Chris Kimble | Jul 9, 2020 | Kimble Charting
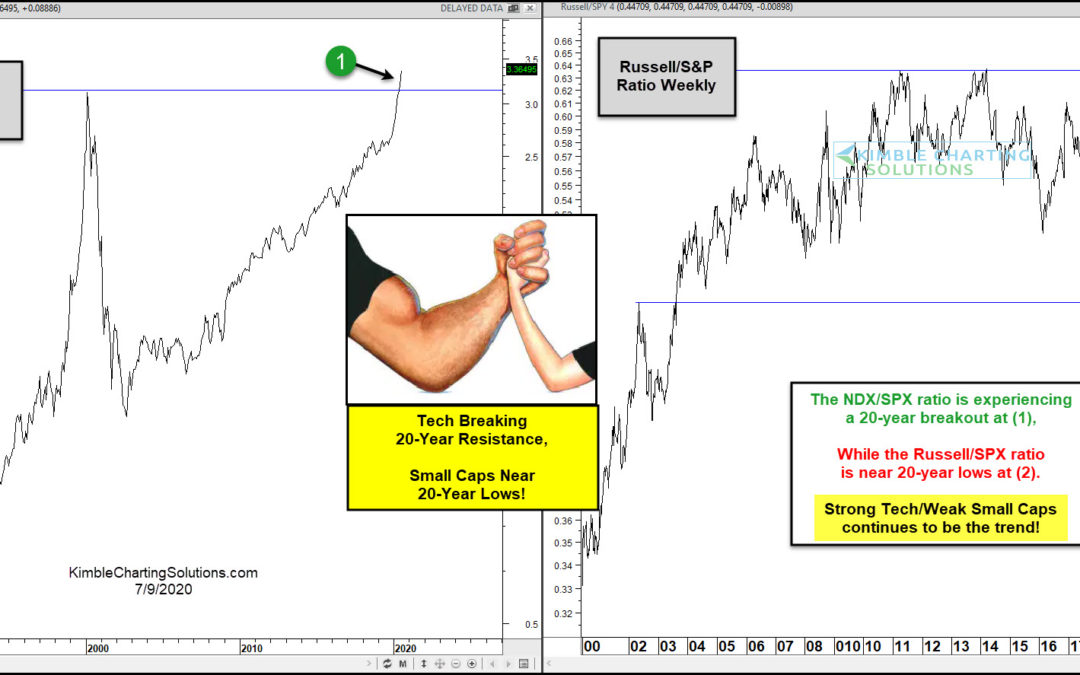
Successful investors are often rewarded by owning strength and avoiding weakness. Could two key sectors be experiencing 20-year strength and weakness extremes at the same time? Yes! The NDX 100/S&P ratio (left above) is currently experiencing a 20-year breakout at...
by Chris Kimble | May 1, 2020 | Kimble Charting
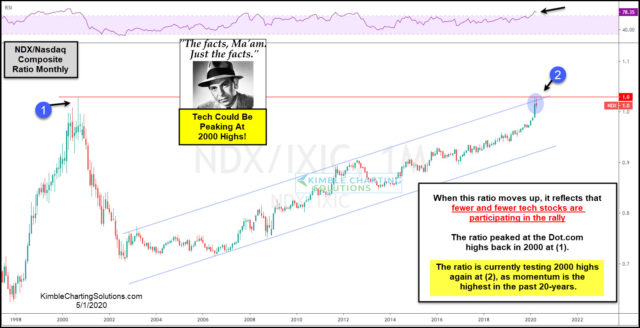
When fewer and fewer stocks are holding up a market, could that end up sending a bearish message to stock market bulls? Yes. This ratio looks at the NDX 100 index compared to the Nasdaq Composite Index. The ratio compares the strength of the 100 largest tech stocks...
by Chris Kimble | Apr 14, 2020 | Kimble Charting
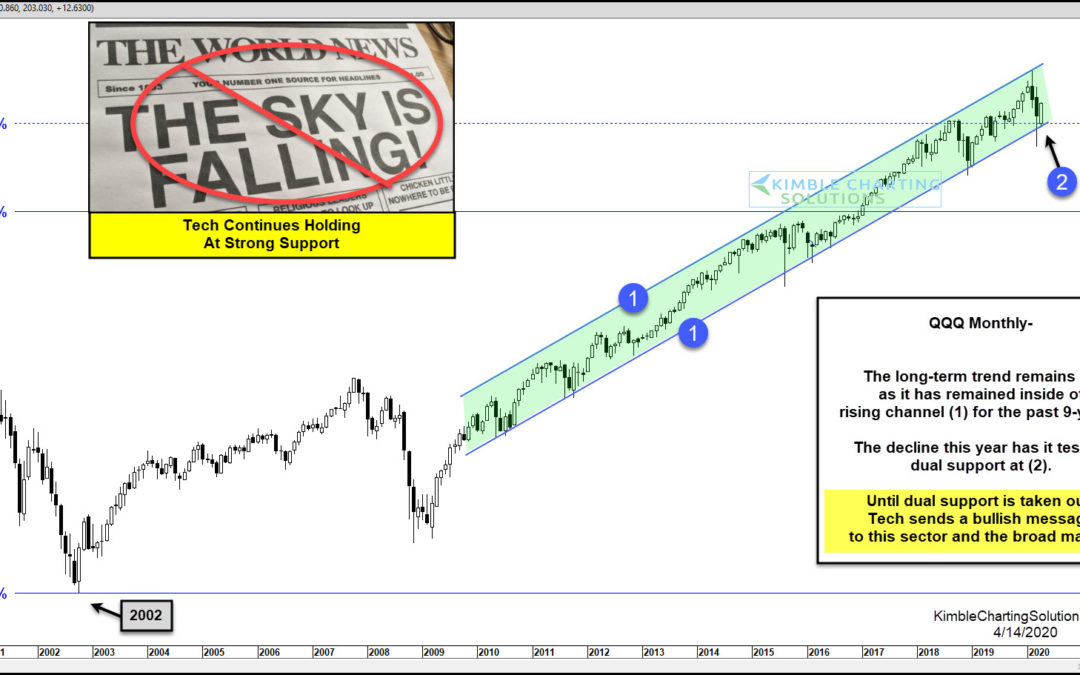
Is the “Sky Falling” for Tech ETF QQQ? It has declined for sure! Has it broken below its 10-year rising channel? Nope This chart looks at QQQ on a monthly basis over the past 20-years. It has spent the majority of the past decade inside of rising channel...
by Chris Kimble | Mar 30, 2020 | Kimble Charting
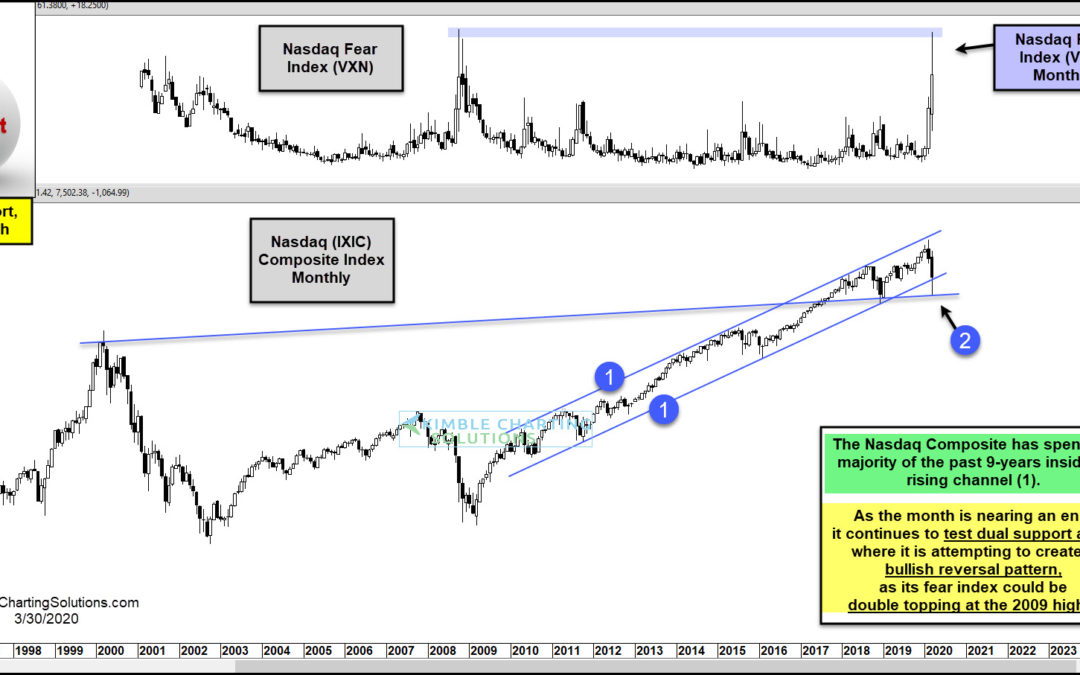
Is an important Tech Index sending a bullish message to investors? It is making an attempt! Does that mean a low in this important sector is in play? Humbly it is too soon to say at this time! This chart looks at the Nasdaq Composite Index over the past 25-years on a...
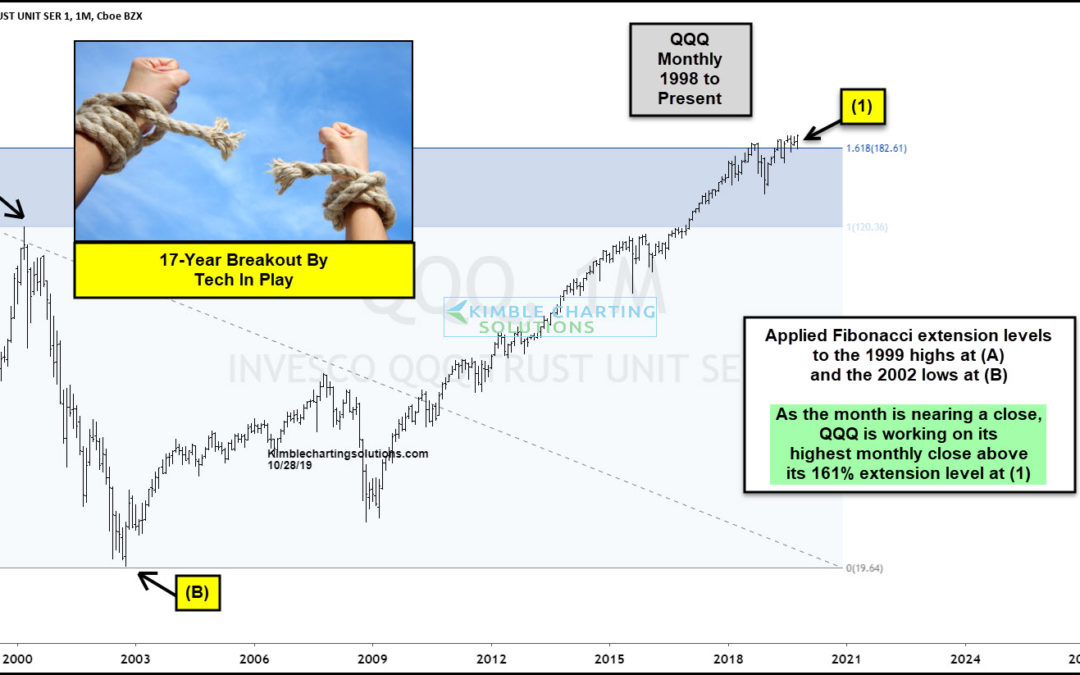
by Chris Kimble | Oct 28, 2019 | Kimble Charting
This chart looks at Tech ETF (QQQ) on a monthly basis over the past 20-years, where Fibonacci extension levels were applied to the 1999 highs at (A) and the 2002 lows at (B). Last September QQQ met a ton of selling pressure on its first attempt to break above the 161%...
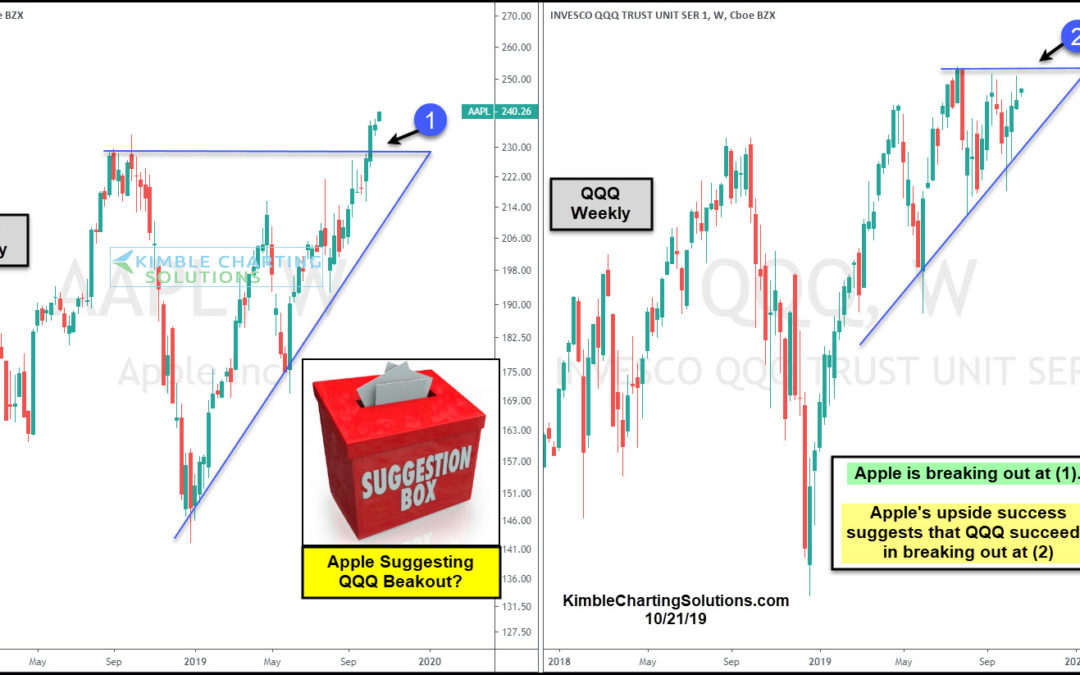
by Chris Kimble | Oct 21, 2019 | Kimble Charting
Is Apple sending a bullish message to the overall Tech market? Sure could be Apple (AAPL) is working on a breakout above last year’s highs at (1), after creating a series of higher lows over the past year. Tech ETF QQQ has been a similar-looking pattern to Apple...
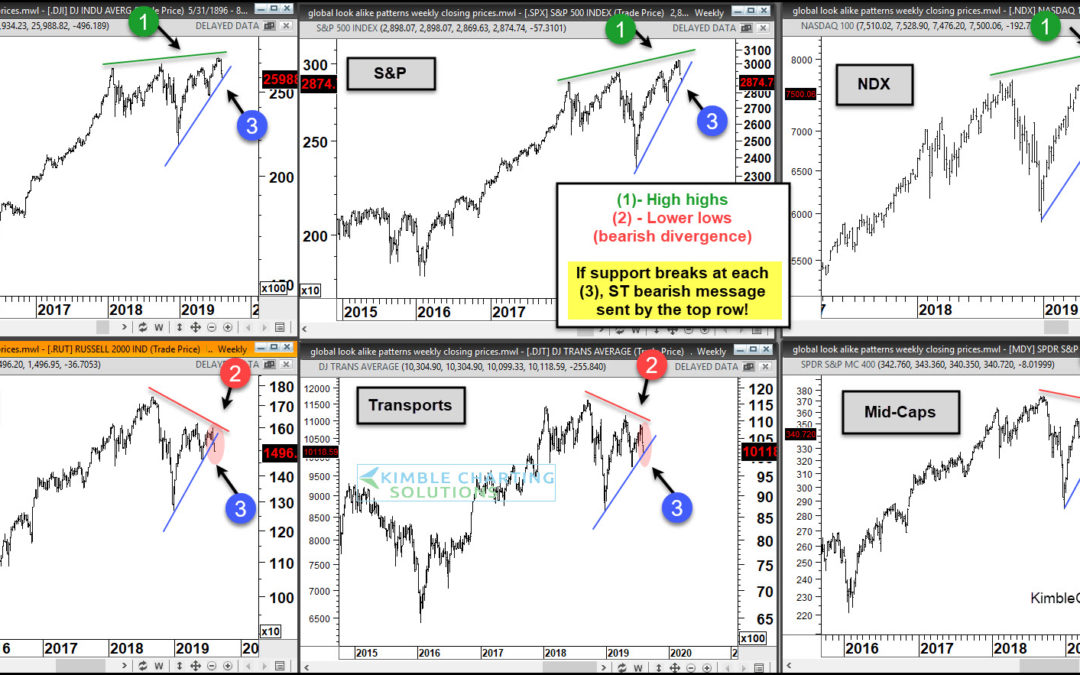
by Chris Kimble | Aug 7, 2019 | Kimble Charting
Stock Market Indexes Topping? Well, that was fast. The stock market pullback has been sharp and likely is not over yet. Last week, I shared the same chart, calling it a “moment of truth” for the stock market. Would the 3 underperforming stock market indexes (in the...
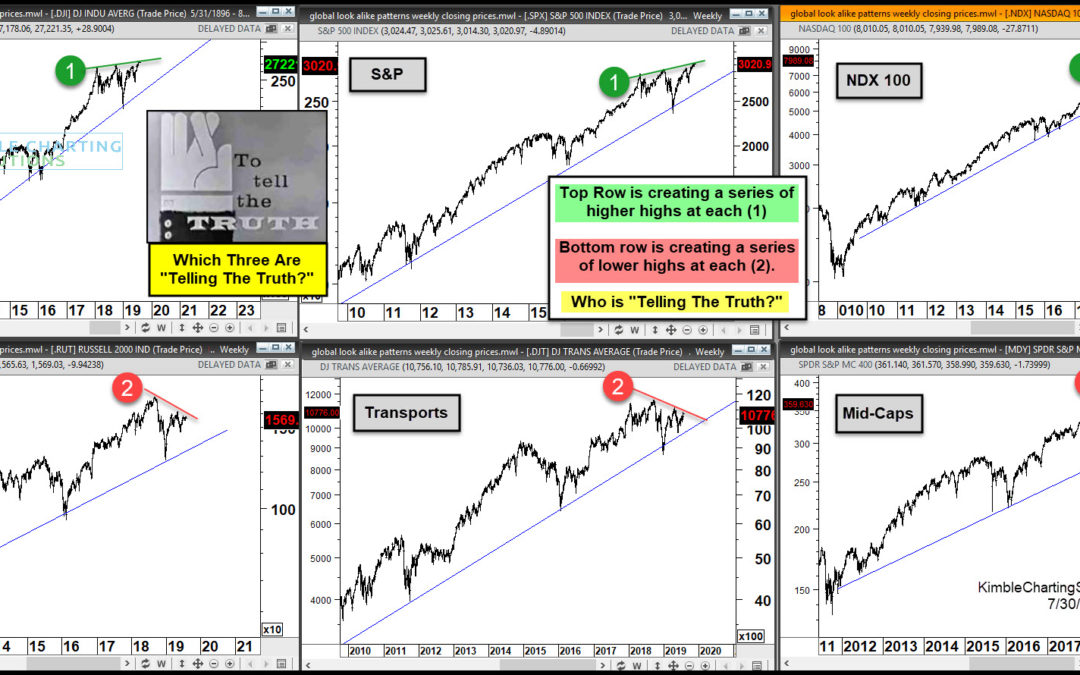
by Chris Kimble | Jul 31, 2019 | Kimble Charting
As investors prepare for the Federal Reserve announcement today, they are feeling pretty good. That’s mostly due to the performance of the “big 3” stock market indexes: the S&P 500 IndexINDEXSP: .INX, Dow Jones IndustrialsINDEXDJX: DJI, and the NasdaqINDEXNASDAQ:...
