
by Chris Kimble | Sep 16, 2015 | Kimble Charting
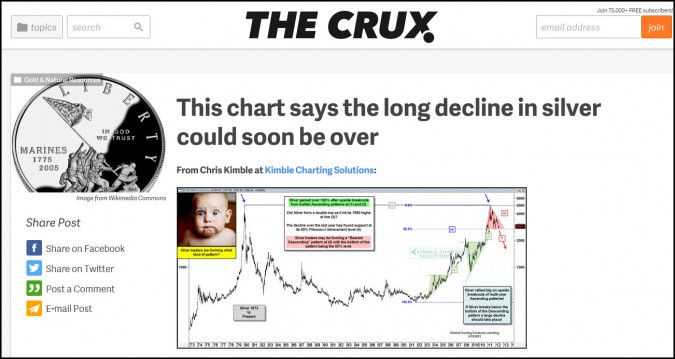
Since May of 2011, its been a rough go for Silver! In a little over the past 4-years, Silver has fallen 68% in value. CLICK ON CHART TO ENLARGE As you can see, Silver hasn’t seen this large of a 4-year decline in the past 30-years! Could this lead to an...
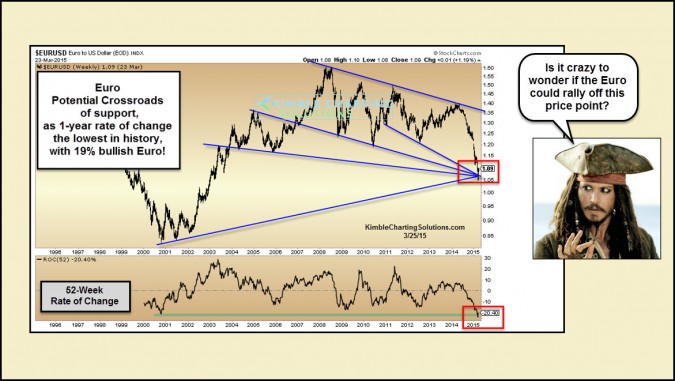
by Chris Kimble | Mar 25, 2015 | Kimble Charting
CLICK ON CHART TO ENLARGE The past year has been rough on the Euro/USD! How rough? The bottom section of the above charts looks at the 52-Week rate of change on the Euro, which reflects the Euro/USD has had the worst one year decline in its history. The decline has...

by Chris Kimble | Feb 17, 2015 | Kimble Charting, Metals
CLICK ON CHART TO ENLARGE One month ago Gold Miners ETF (GDX) had just experienced the best 3-week rally in the history of the ETF (Up 24% in three weeks)! (see post here) Aggressive Metals members were on board for this historic rally, due to buying on support. The...

by Chris Kimble | Nov 25, 2014 | Kimble Charting
CLICK ON CHART TO ENLARGE I often get ask….”What does an ideal Power of the Pattern set up look like?” For us and ideal set up has these common features – Support/channel lines come into play, along with a Fibonacci support/resistance...

by Chris Kimble | Nov 21, 2014 | Kimble Charting
CLICK ON CHART TO ENLARGE Bullish wicks at support can be create nice buying opportunities. A month ago Premium Members took advantage of bullish wicks in stocks and took “Pocket Change Gains” here. (see post here) Silver is hitting dual...

by Chris Kimble | Nov 8, 2014 | Kimble Charting
CLICK ON CHART TO ENLARGE So goes this leading ratio indicator (Silver Wheat/Silver) often times, so goes Silver! Most are well aware that the metals complex has been very weak of late, with Silver leading the way to the downside. What has been even...
by Chris Kimble | Oct 3, 2014 | Kimble Charting
See Full Article at the Daily Crux (see here) – –

by Chris Kimble | Sep 22, 2014 | Kimble Charting
CLICK ON CHART TO ENLARGE The above chart was created when Silver was trading at $28 per ounce. I shared with Premium Members in June of 2012, that Silver looked to be creating a bearish descending triangle and the measured move was calling for Silver to...
