by Chris Kimble | Jan 4, 2021 | Kimble Charting
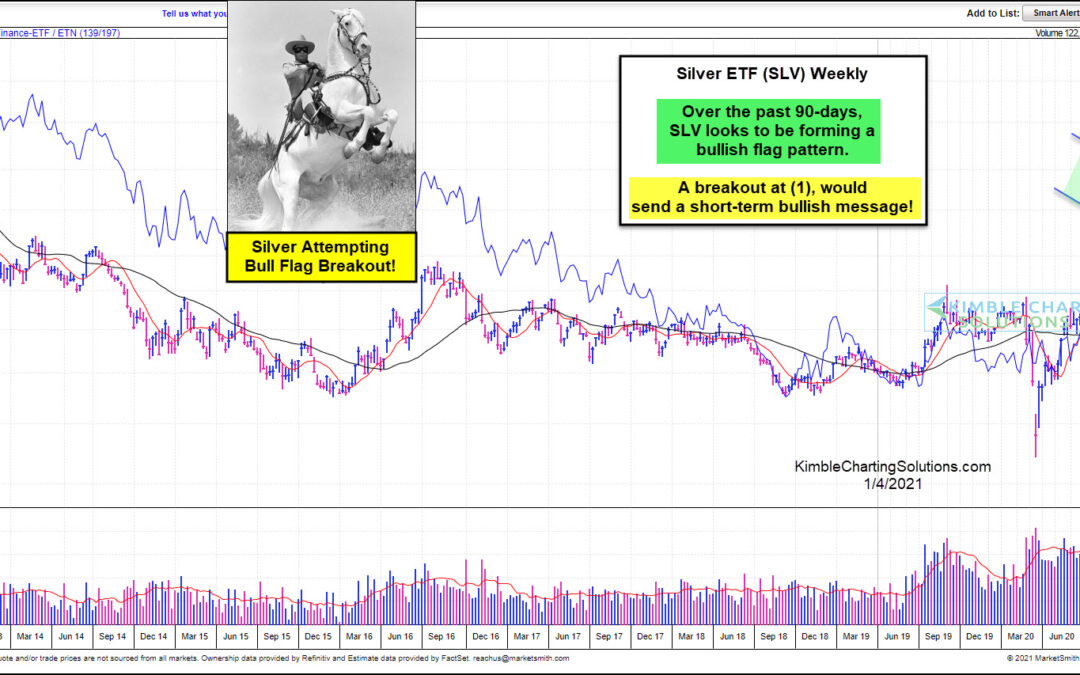
Is a Hi-Yo Silver bullish message about to take place in the short-term? This chart from Marketsmith.com suggests that a breakout attempt from a bull flag pattern is being attempted. Since peaking in August of 2020, Silver ETF (SLV) has created a series of lower...
by Chris Kimble | Dec 21, 2020 | Kimble Charting
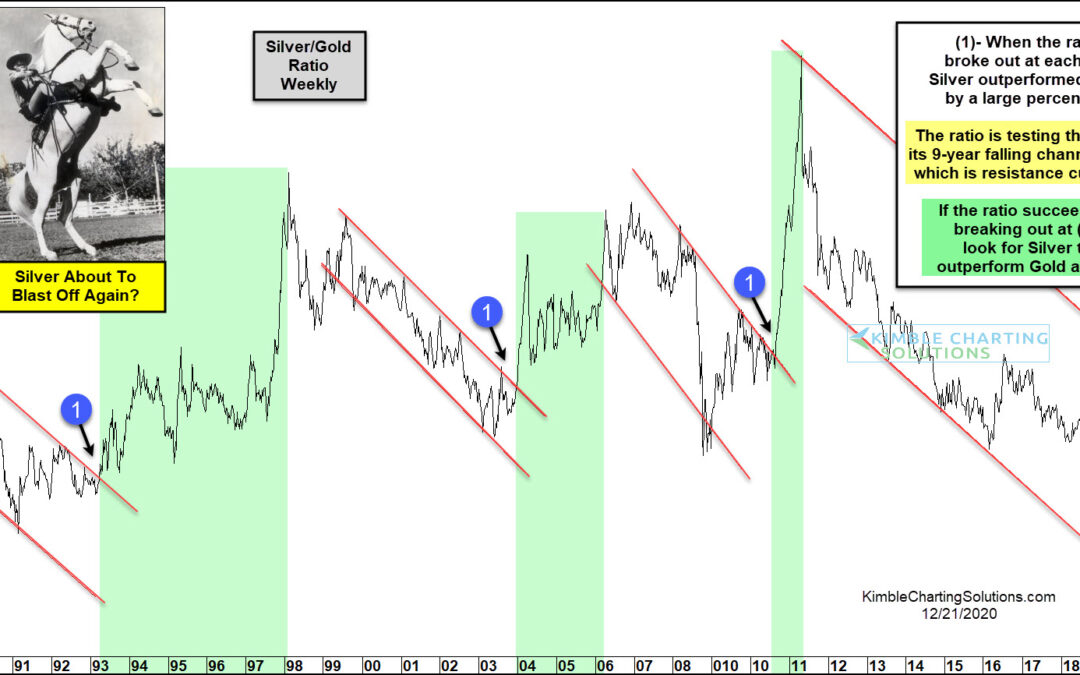
Precious metals are having a strong year in 2020. So is it any surprise that Silver has been leading Gold higher? As I’ve said before, Silver is to precious metals what small-cap stocks are to the broad market… it’s always beneficial when they lead In today’s chart...
by Chris Kimble | Jul 27, 2020 | Kimble Charting
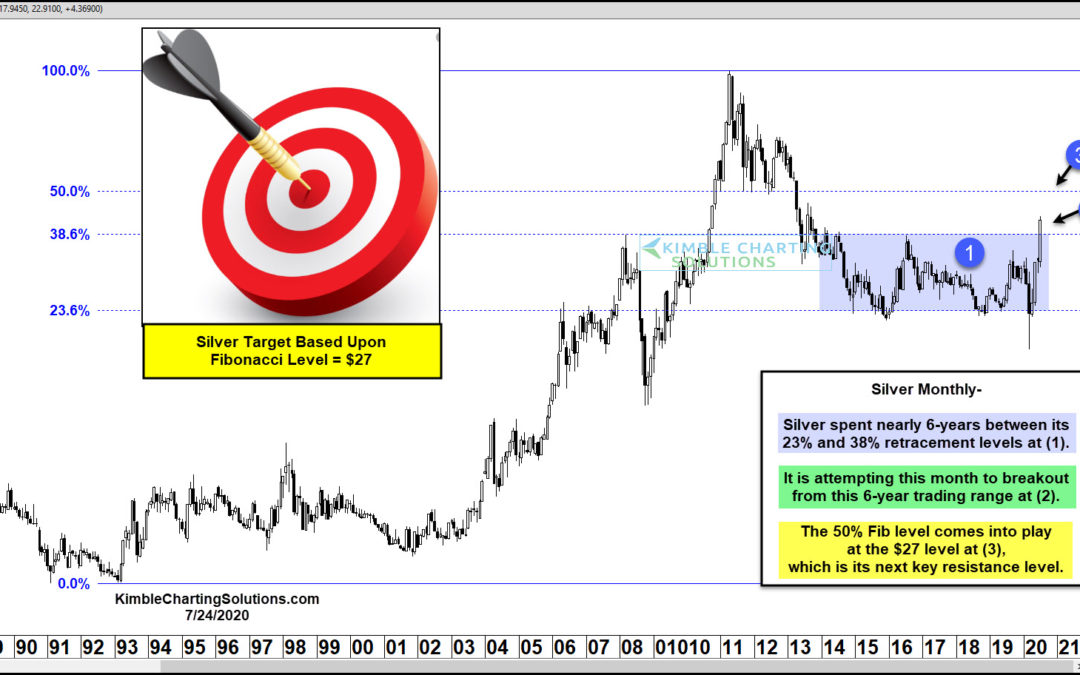
Silver is finally waking up from a long bear market and multi-year slumber. Gold kick-started the precious metals rally and finally Silver is following suit… and perhaps even leading. In today’s chart, we can see that the price of Silver is breaking above a 6-year...
by Chris Kimble | May 18, 2020 | Kimble Charting
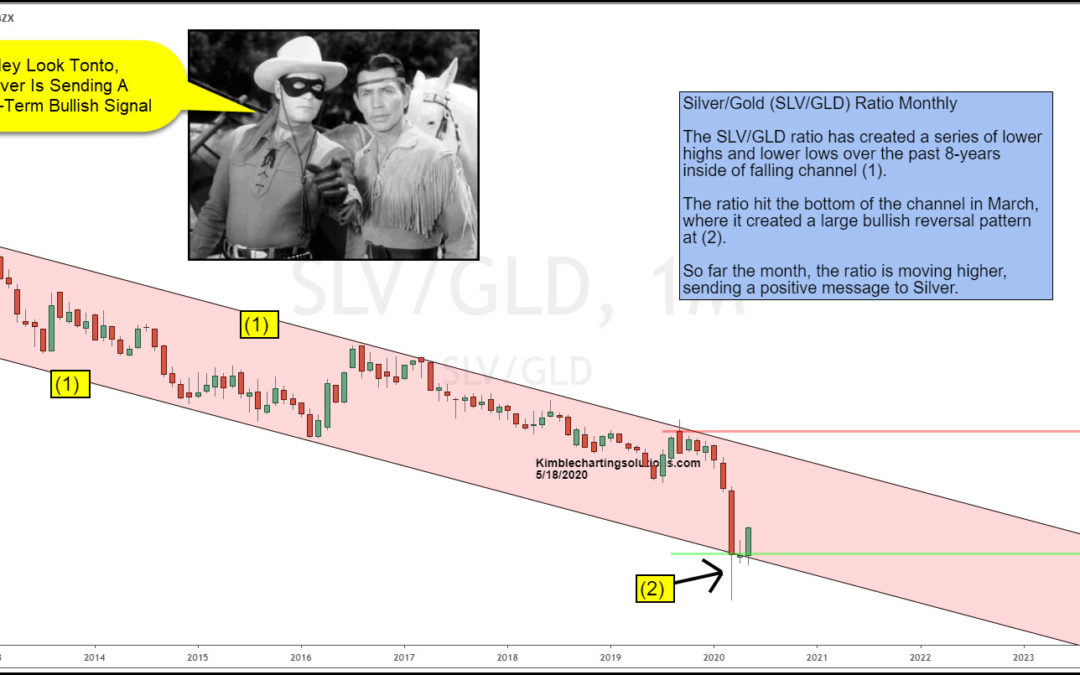
Silver has been much weaker than Gold over the past 8-years! Is that trend about to change? Possible! This chart looks at the Silver ETF & Gold ETF (SLV/GLD) ratio on a monthly basis over the past 8-years. No doubt the trend for the ratio is lower, as it has...
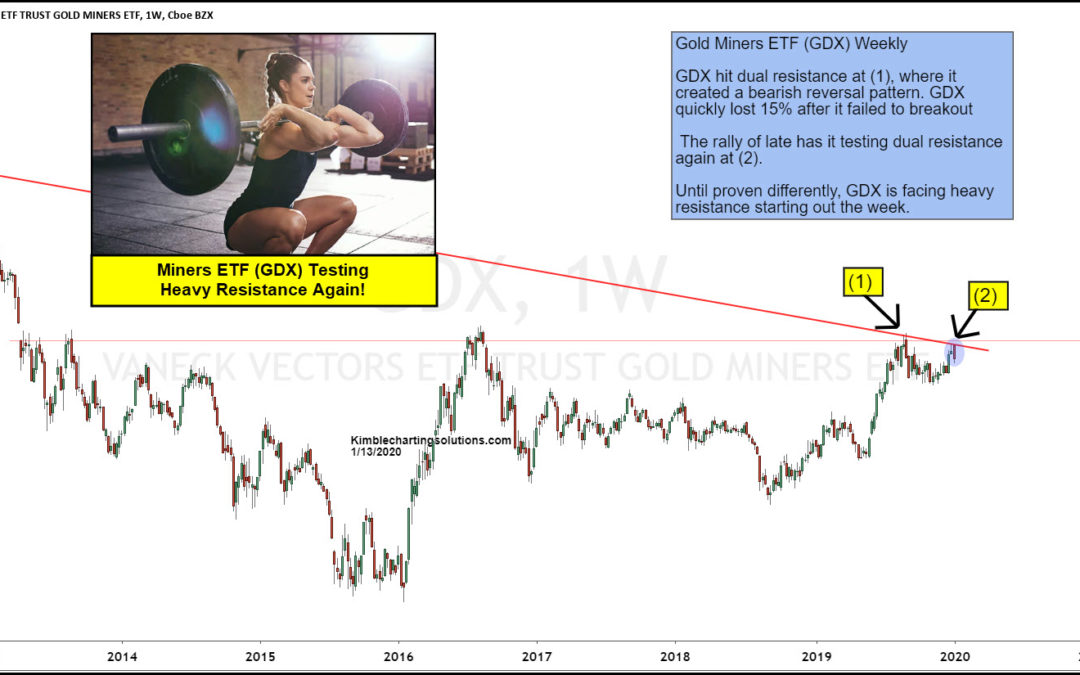
by Chris Kimble | Jan 13, 2020 | Kimble Charting
In September of 2019, Gold Miners ETF (GDX) testing long-term resistance at (1), and then it quickly declined 15%. This resistance level has been heavy for GDX has it failed to break above this level twice in 2013 and once in 2016. Each time GDX peaked in those years,...
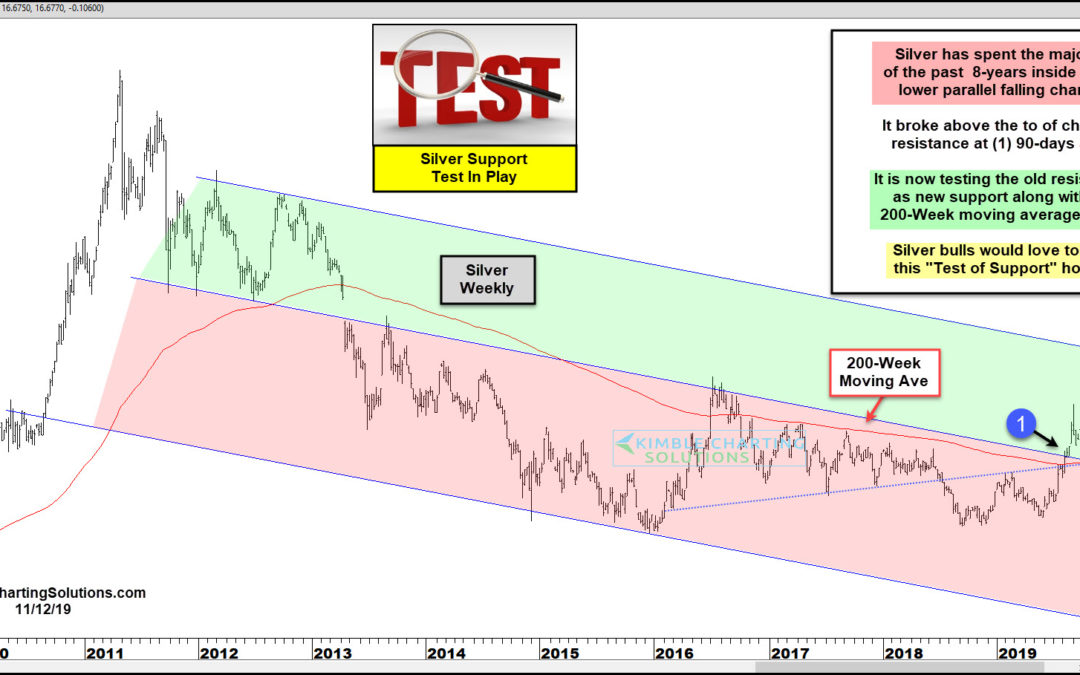
by Chris Kimble | Nov 13, 2019 | Kimble Charting
Its been a good while since Silver bulls could say that it is testing support. Well, this week that can be said! Will this support test hold? Silver Bulls sure hope so! This chart looks at Silver Futures over the past 10-years. Silver has spent the majority of the...

by Chris Kimble | Sep 7, 2019 | Kimble Charting
The rally in Silver prices has been fast and furious, producing a steep up-trend in the Silver ETF and Silver Futures charts. A similar rally can be seen in treasury bond yields, specifically the 10-Year Treasury Bond Yield In fact, treasury bond yields and silver...
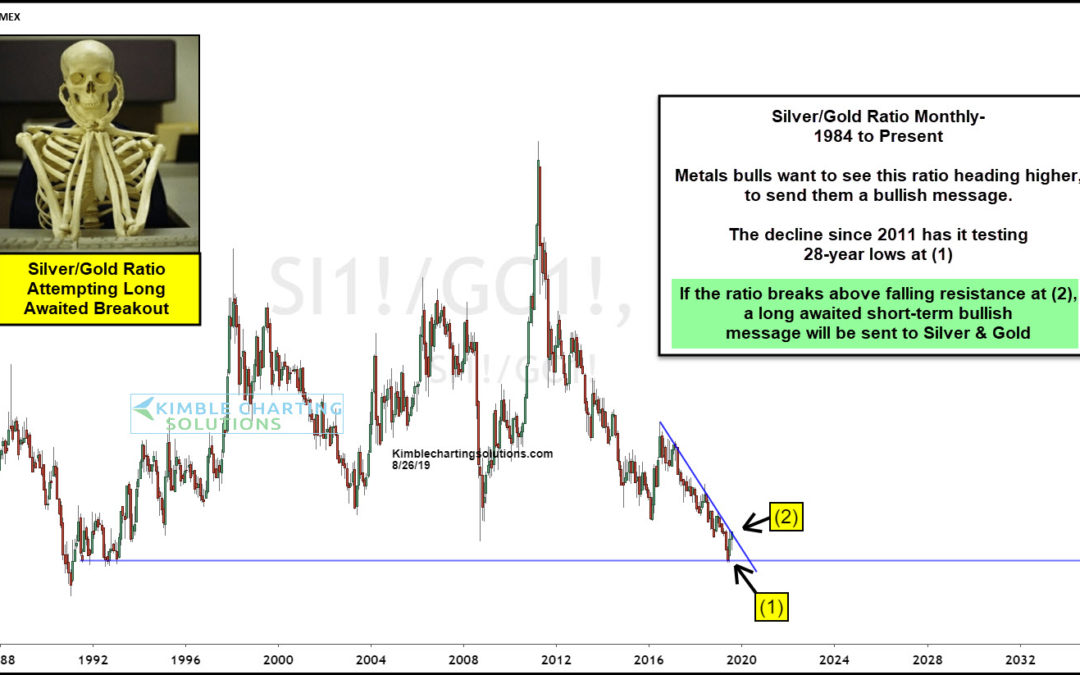
by Chris Kimble | Aug 27, 2019 | Kimble Charting
Are metals bulls about to receive a long-awaited positive message? It won’t take long to find out based upon this chart! This chart looks at the Silver/Gold ratio on a monthly basis since the early 1980s. Metals bulls historically want to see this ratio moving...
