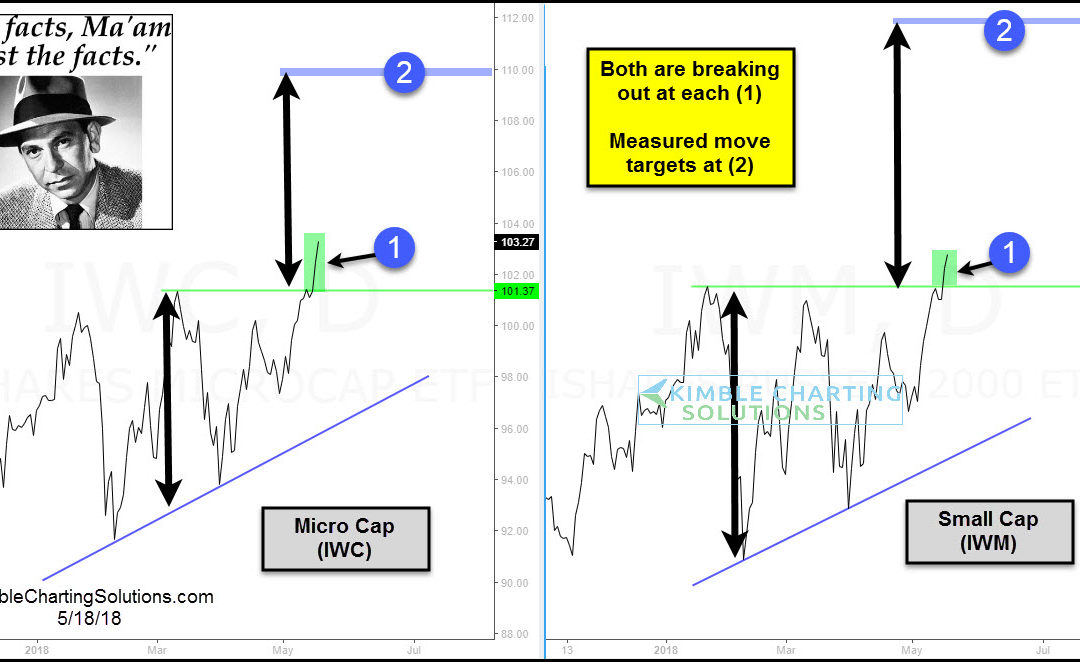
by Chris Kimble | May 18, 2018 | Kimble Charting
CLICK ON CHART TO ENLARGE While the Dow, S&P 500, Nasdaq 100 and the NYSE all continue to chop sideways and remain below highs hit in January, the same can not be said for Small Caps (IWM) and Micro Caps (IWC). The 2-pack above highlights that IWM & IWC both...
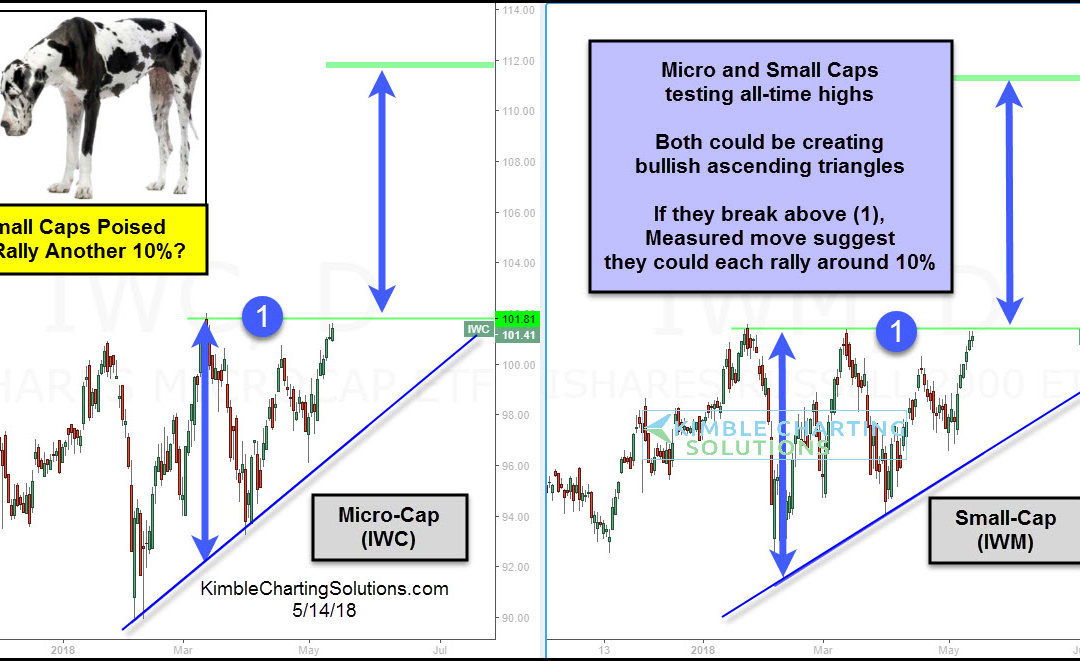
by Chris Kimble | May 14, 2018 | Kimble Charting
CLICK ON CHART TO ENLARGE Year to date, Micro (IWC) and Small Caps (IWM) are acting stronger than large caps. The strength in IWC and IWM have both of them testing all-time highs this week, which could be the top of bullish ascending triangles at each (1). Two-thirds...
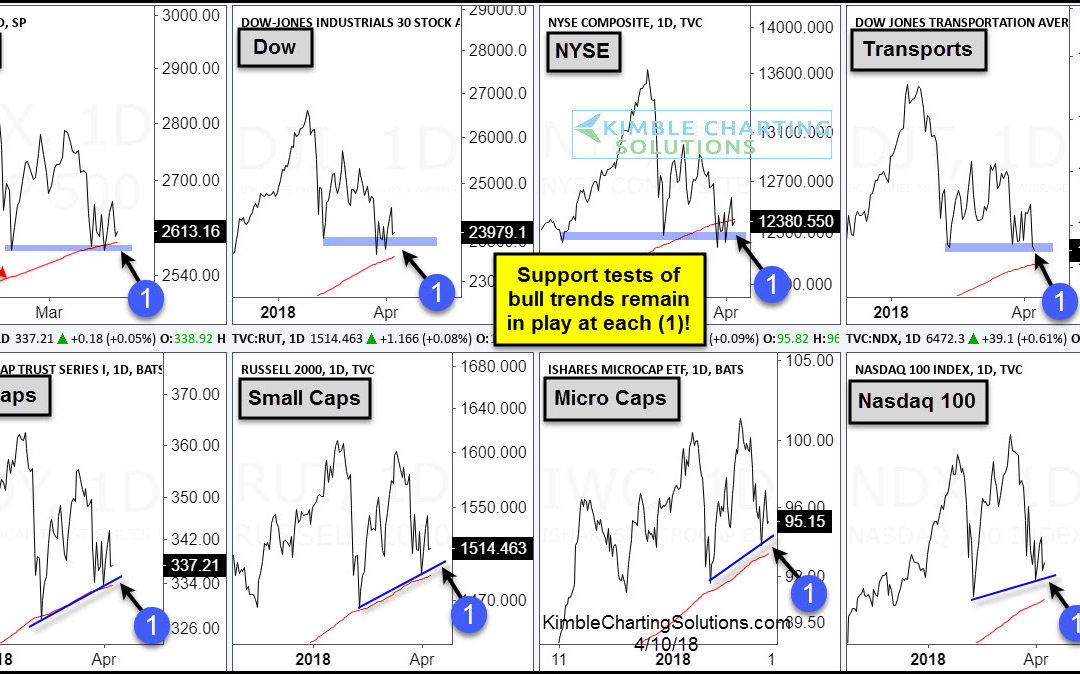
by Chris Kimble | Apr 10, 2018 | Kimble Charting
CLICK ON CHART TO ENLARGE The chart above looks at performance numbers of several key indices on a Year-To-Date basis and from the highs in January. Both highlight that these indices are soft and mostly choppy so far this year. The 8-pack below looks numerous stock...

by Chris Kimble | Nov 21, 2017 | Kimble Charting
Small cap stocks tend to offer a bit more risk and reward. That equates to higher beta, which in turn tends to mean stronger returns when the broader market is healthy, and weaker returns when the broader market is in the doldrums. So where are we now? Likely at an...

by Chris Kimble | Sep 26, 2017 | Kimble Charting
Year to date, Small and Micro Caps stocks don’t have a ton to brag about when compared to the S&P 500, as both are lagging by several percentage points. Below looks at the performance of them to the broad market over the past 30-days, which reflects that...

by Chris Kimble | Jun 28, 2017 | Kimble Charting
So far this year, Small & Micro Cap ETF’s are lagging the S&P 500. Over the past month the opposite is taking place, as small and micro caps have been stronger. Below takes a peak at micro cap ETF (IWC) and the potential bullish pattern it is attempting...

by Chris Kimble | Jun 13, 2017 | Kimble Charting
The S&P 500 has done well this year, up almost 8% as we approach the half way point of the year. Mid, Small and Micro caps can’t say the same performance wise, as each is lagging large caps so far this year. See chart below. CLICK ON CHART TO ENLARGE Could...

by Chris Kimble | Apr 3, 2017 | Kimble Charting
Most are familiar with the idea of “Sell in May and go away.” Should one take this advice and sell a month earlier this year? The chart below is from good friend Ryan Detrick, looking at monthly returns of the S&P 500’s performance, over four...
