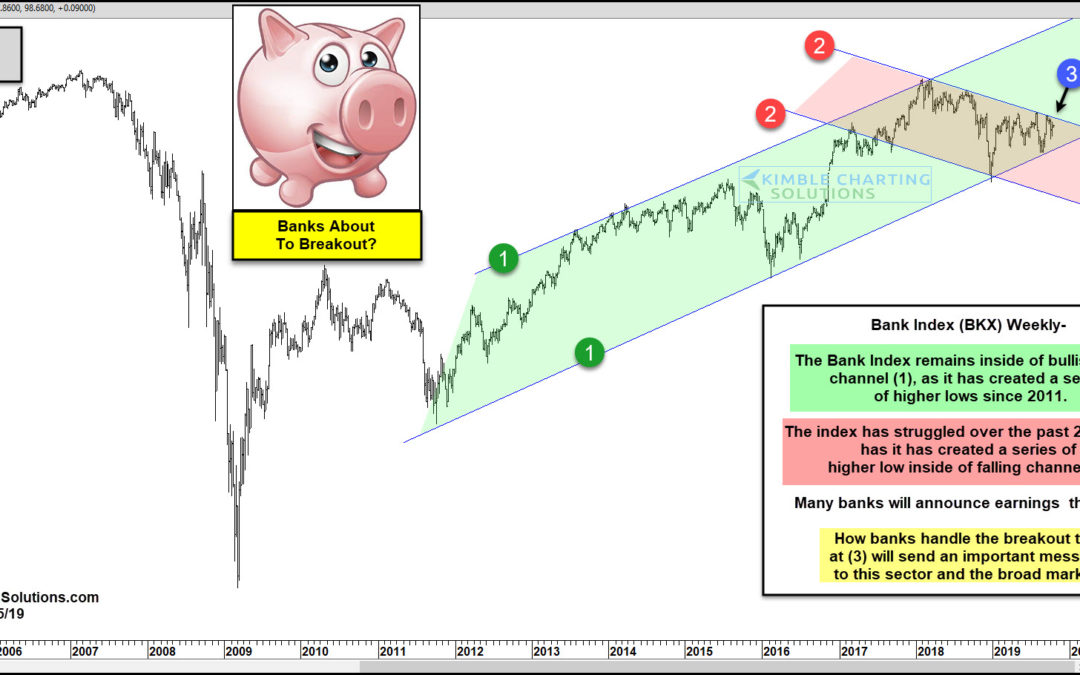
by Chris Kimble | Oct 15, 2019 | Kimble Charting
Bank earnings could go a long way to impacting the broad market in a big way this week. Wells Fargo, Goldman Sachs, Bank Of America, JP Morgan, Morgan Stanley all announce earning the next couple of days. As these earning announcements are to take place, the Bank...
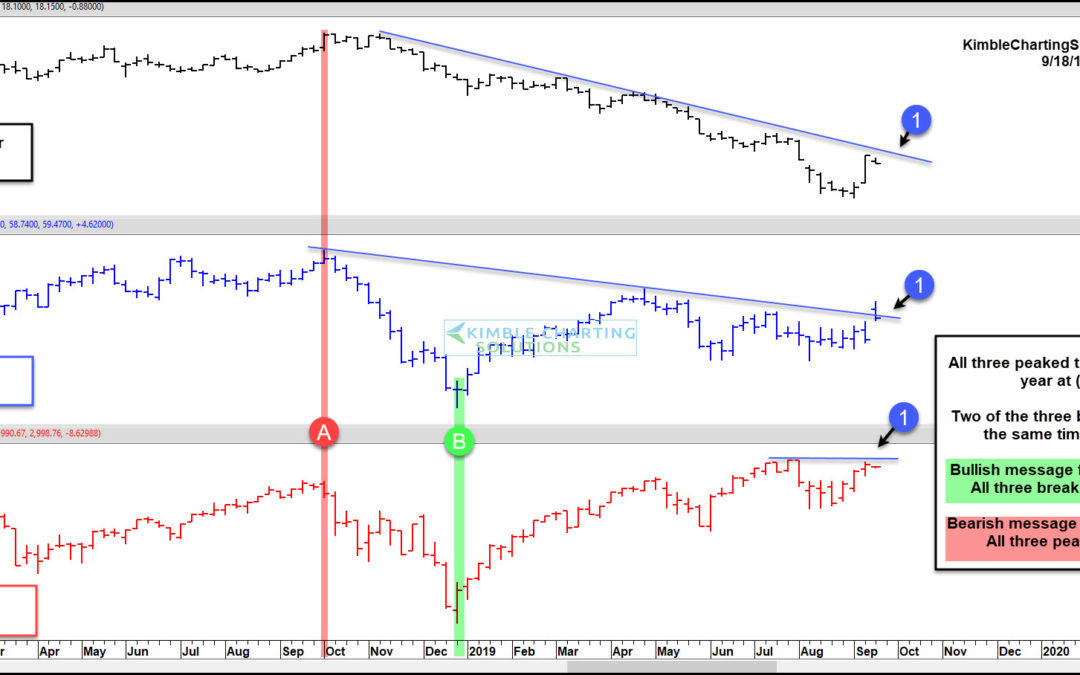
by Chris Kimble | Sep 18, 2019 | Kimble Charting
It’s not often that three asset classes reach similar important trading points all at once. But that’s exactly what’s happening right now with stocks, crude oil, and treasury bond yields. And this is occurring on Federal Reserve day no less! Something has got to give....
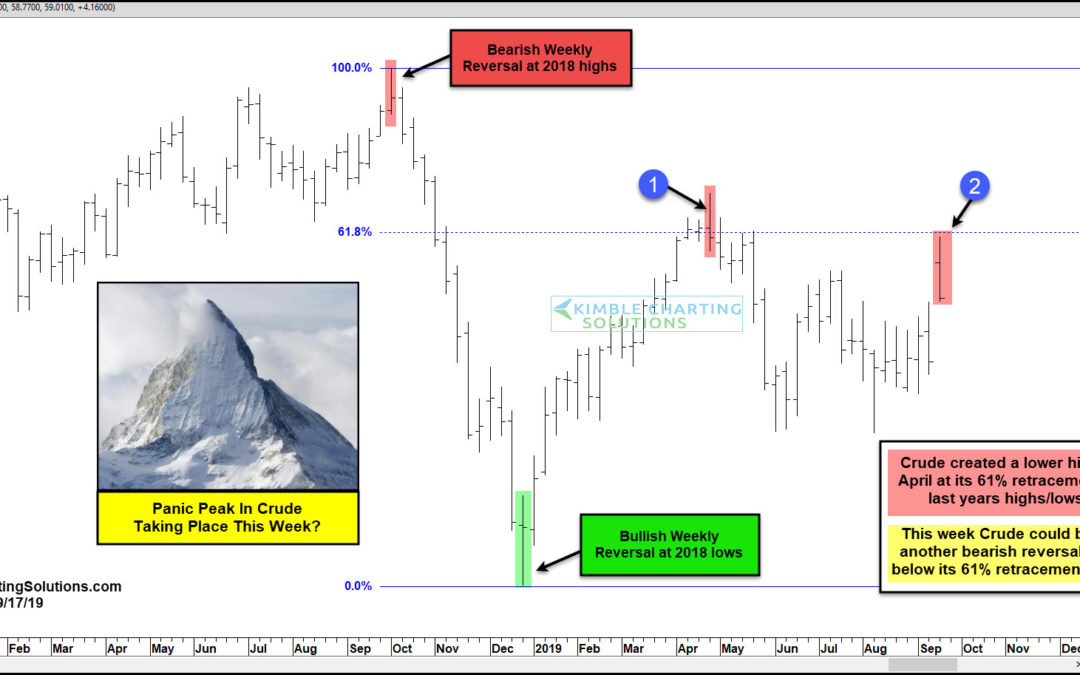
by Chris Kimble | Sep 17, 2019 | Kimble Charting
Yesterday Crude Oil rallied nearly 15%. How often does Crude rally this much in a day? Not often! How many times has Crude rallied nearly 15% in the past 20-years? Only one other time, which suggests that yesterdays move was a rare event. This chart looks at Crude Oil...
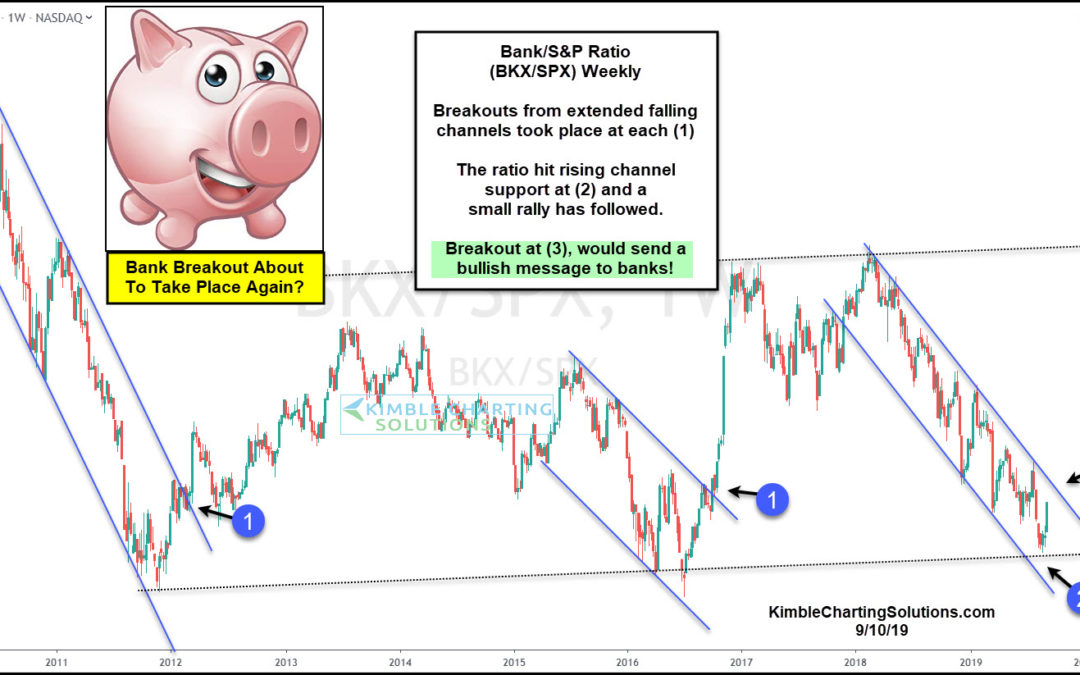
by Chris Kimble | Sep 10, 2019 | Kimble Charting
The Bank Index BKX has been trading in a downtrend since early 2018. And it has been underperforming the broad stock market indices as well. Is the bad news for banks stocks about to end? Stock market bulls sure hope so, as the stock market tends to be on stronger...
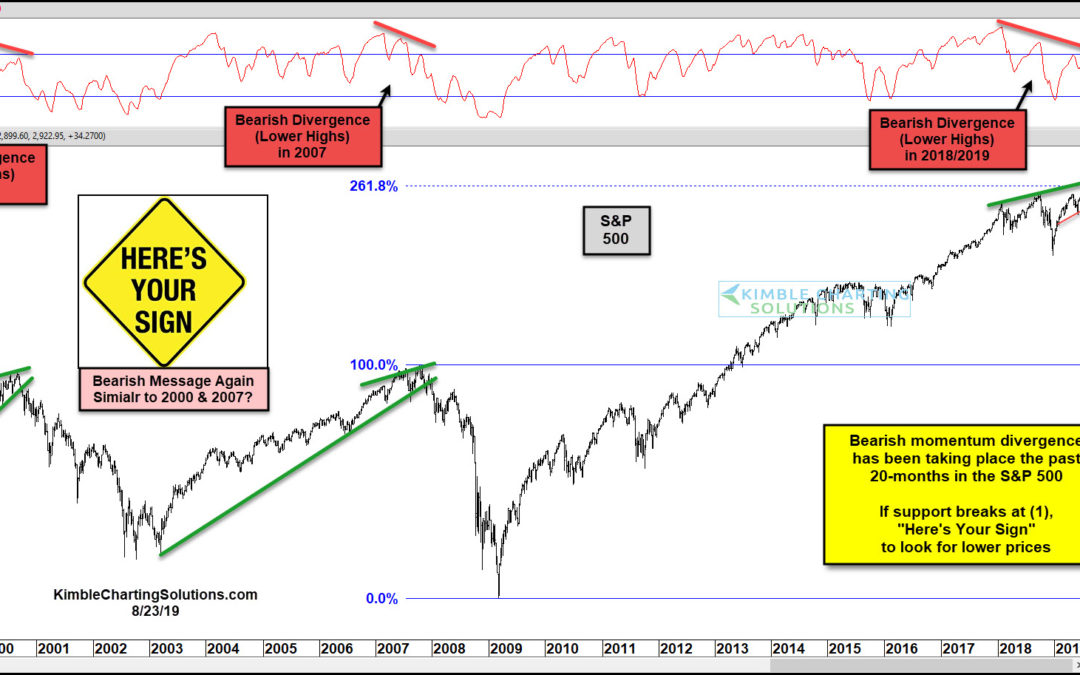
by Chris Kimble | Aug 23, 2019 | Kimble Charting
Does history at important junctures ever repeat itself exactly? Nope Do look-alike patterns take place at important price points? Yup This chart looks at the S&P 500 over the past 20-years. In 2000 and 2007 bearish momentum divergences took place months ahead of...
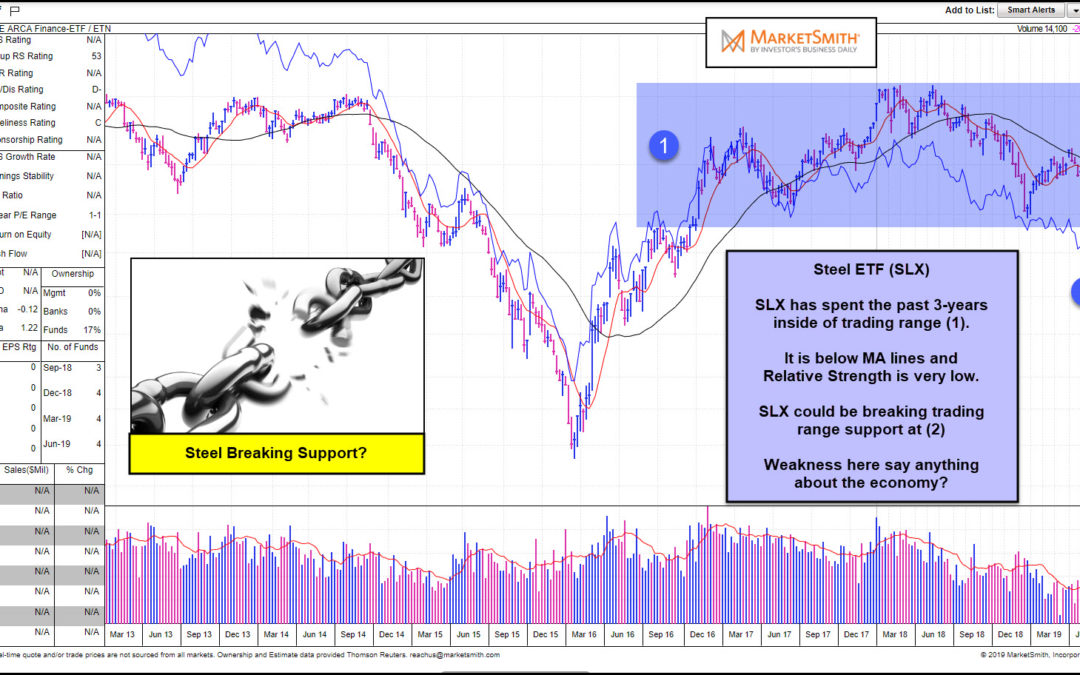
by Chris Kimble | Aug 20, 2019 | Kimble Charting
Is the Steel Industry suggesting that a recession is nearing? In my humble opinion, the jury is still out on this one. This chart from Marketsmith.com takes a look at the patterns of Steel ETF (SLX). SLX has spent the majority of the past 3-years inside of trading...
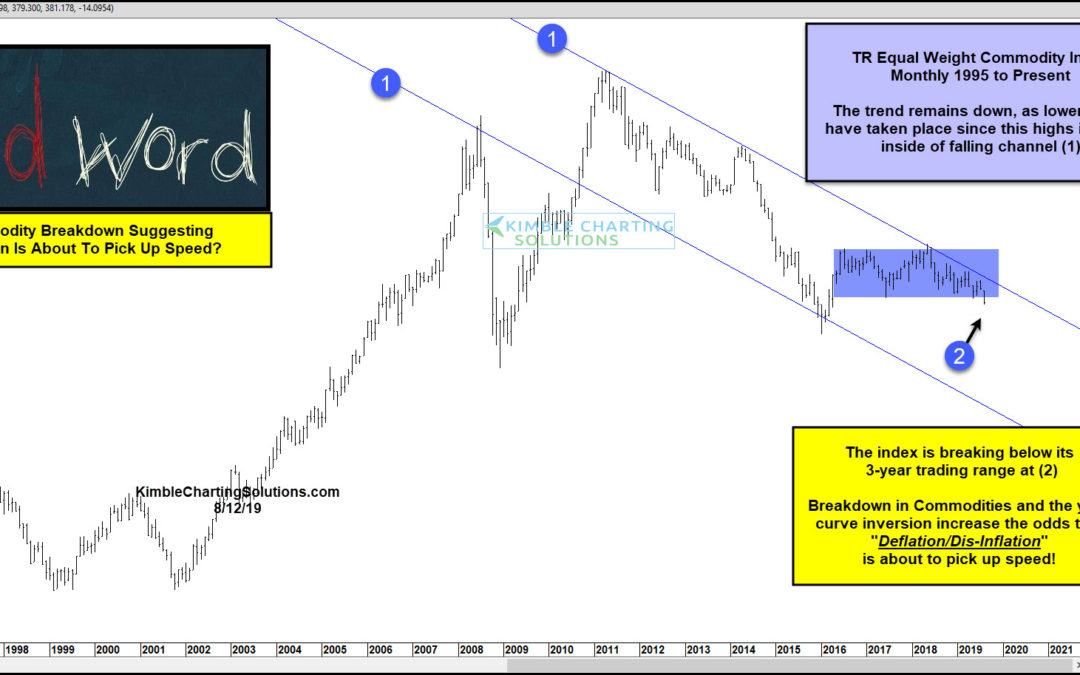
by Chris Kimble | Aug 14, 2019 | Kimble Charting
The big news of the day seems to be the inversion of the yield curve. An inversion oftentimes suggests that the economy will be slowing in the future and recession odds increase. Another important economic message looks to be coming from the Thomson Reuter Equal...
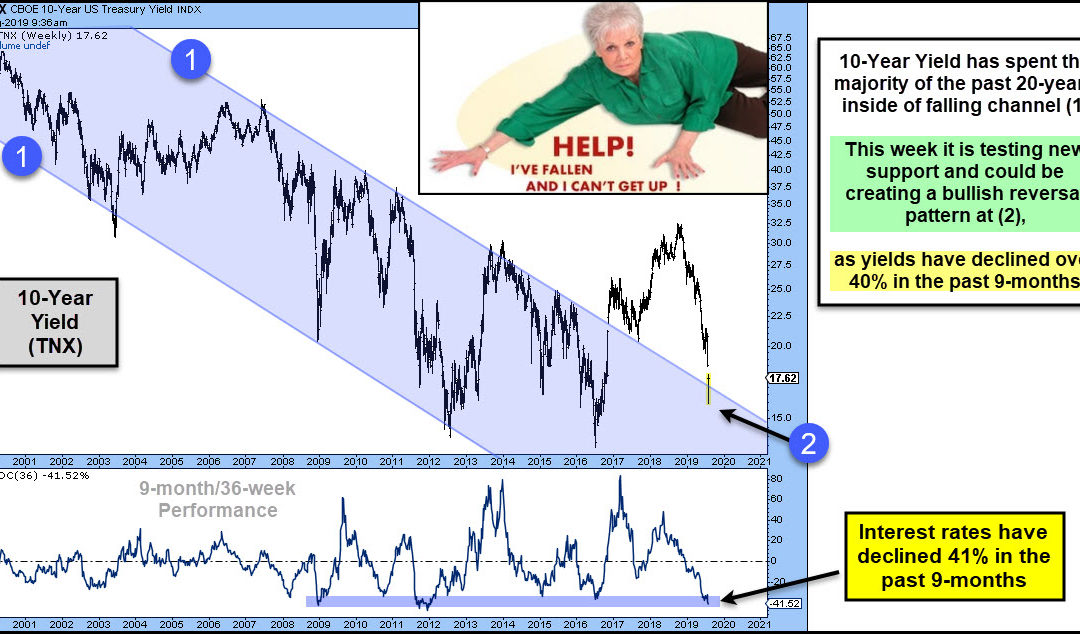
by Chris Kimble | Aug 8, 2019 | Kimble Charting
Interest rates have declined over 40% in the past 9-months. Could they be near a short-term low? Stocks most likely hope so. This chart looks at the yield on the 10-year note (TNX) over the past 20-years. The majority of the past couple of decades rates have declined...
