by Chris Kimble | Jul 31, 2019 | Kimble Charting
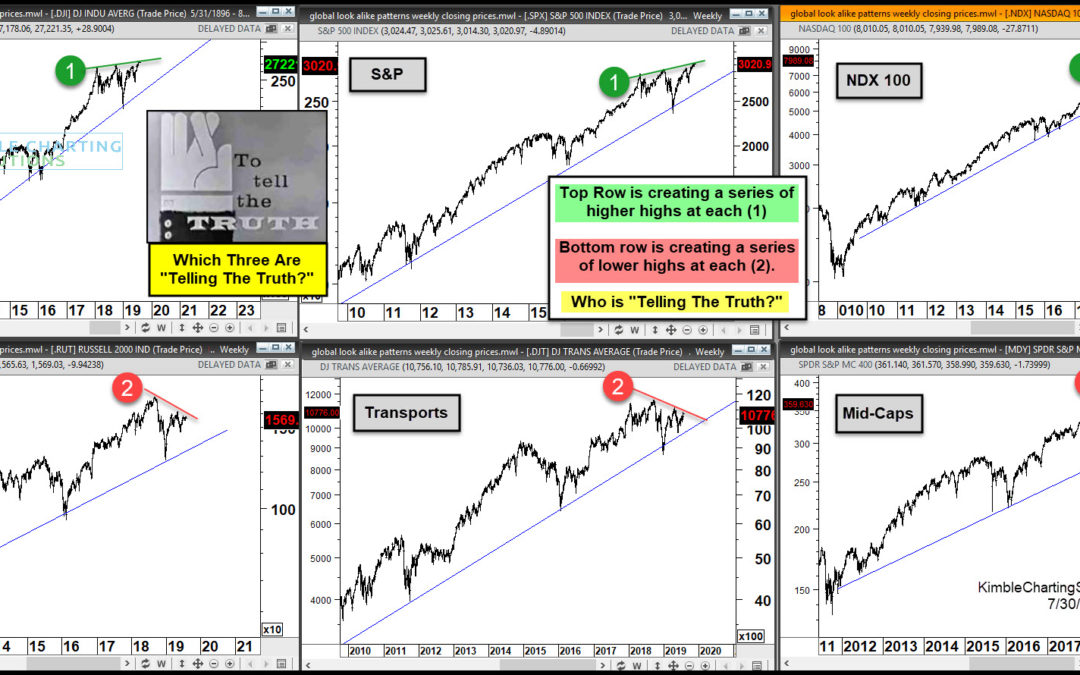
As investors prepare for the Federal Reserve announcement today, they are feeling pretty good. That’s mostly due to the performance of the “big 3” stock market indexes: the S&P 500 IndexINDEXSP: .INX, Dow Jones IndustrialsINDEXDJX: DJI, and the NasdaqINDEXNASDAQ:...
by Chris Kimble | Jul 29, 2019 | Kimble Charting
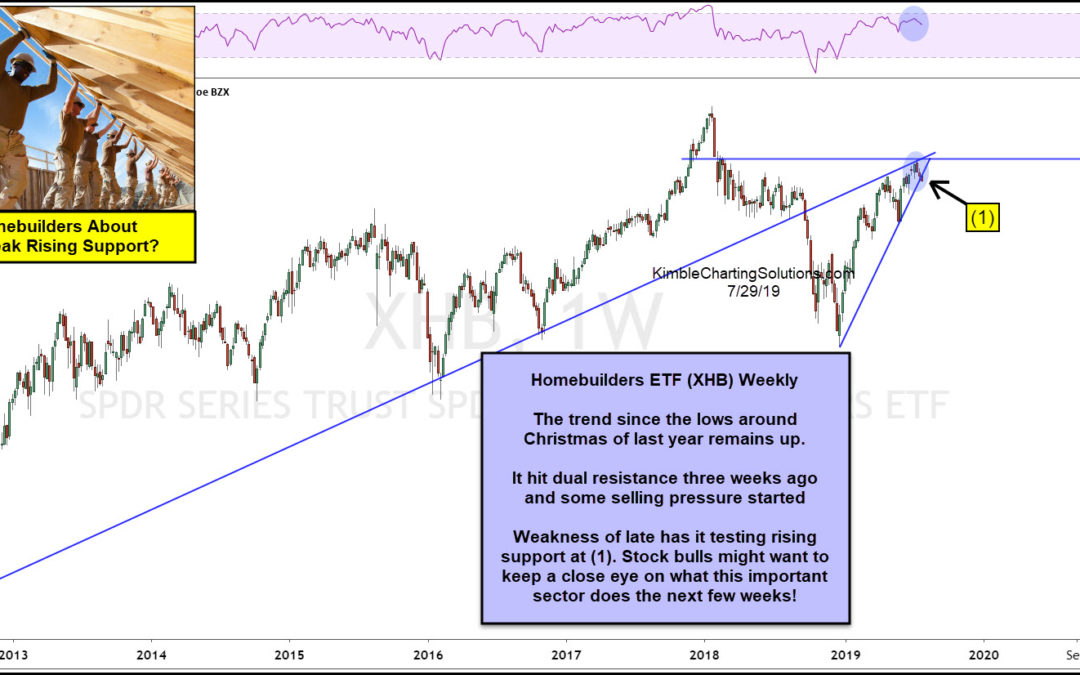
Sometimes the ole phrase “So Goes Homebuilders, So Goes The Economy Is True!” This chart looks at an important sector of our economy, which is the Homebuilders ETF (XHB). The long-term trend remains up, yet over the past year, it is experiencing a negative...
by Chris Kimble | Jul 10, 2019 | Kimble Charting
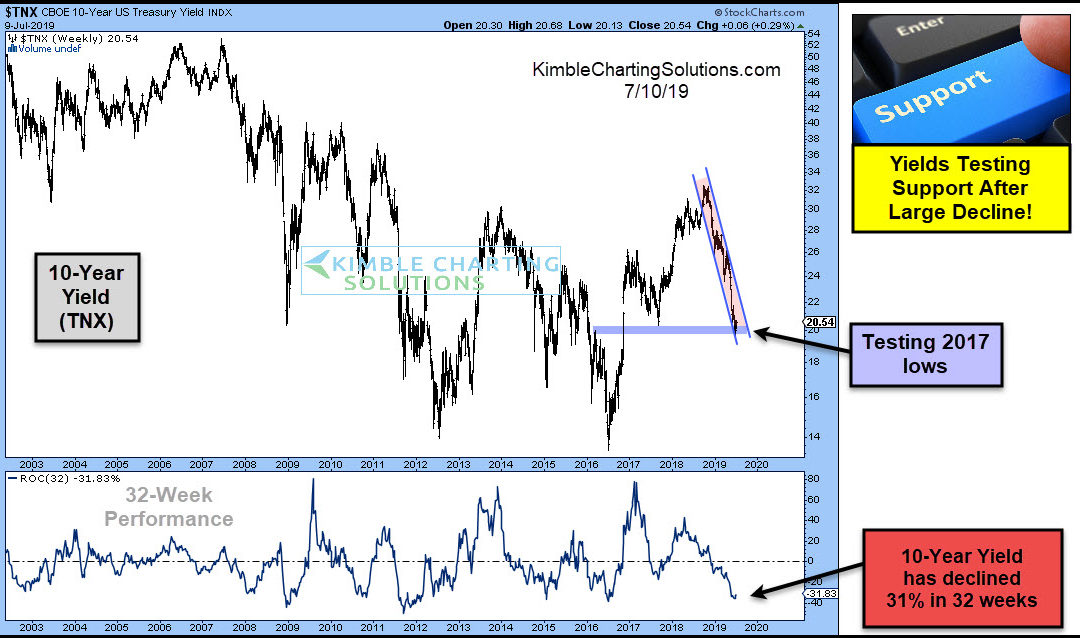
Will the Fed lower interest rates today? They could if they follow the yield on the 10-year note over the past 32-weeks! This chart reflects that the yield on the 10-year note (TNX) has declined 31% in the past 32-weeks. This decline has yields testing 2017 lows while...
by Chris Kimble | Jun 28, 2019 | Kimble Charting
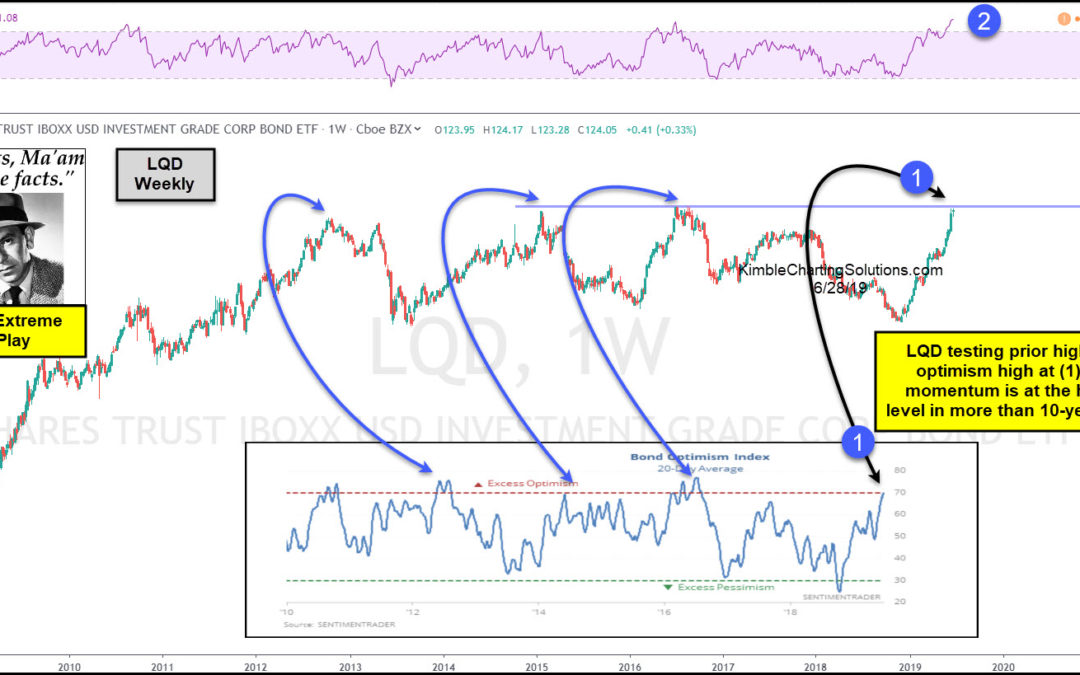
Are investment grade bonds peaking? Some conditions suggest its possible, says Joe Friday! This chart looks at Investment Grade Bond ETF (LQD) over the past 10-years. LQD has moved sharply higher since the lows in December of 2018. The rally has LQD testing its 2015...
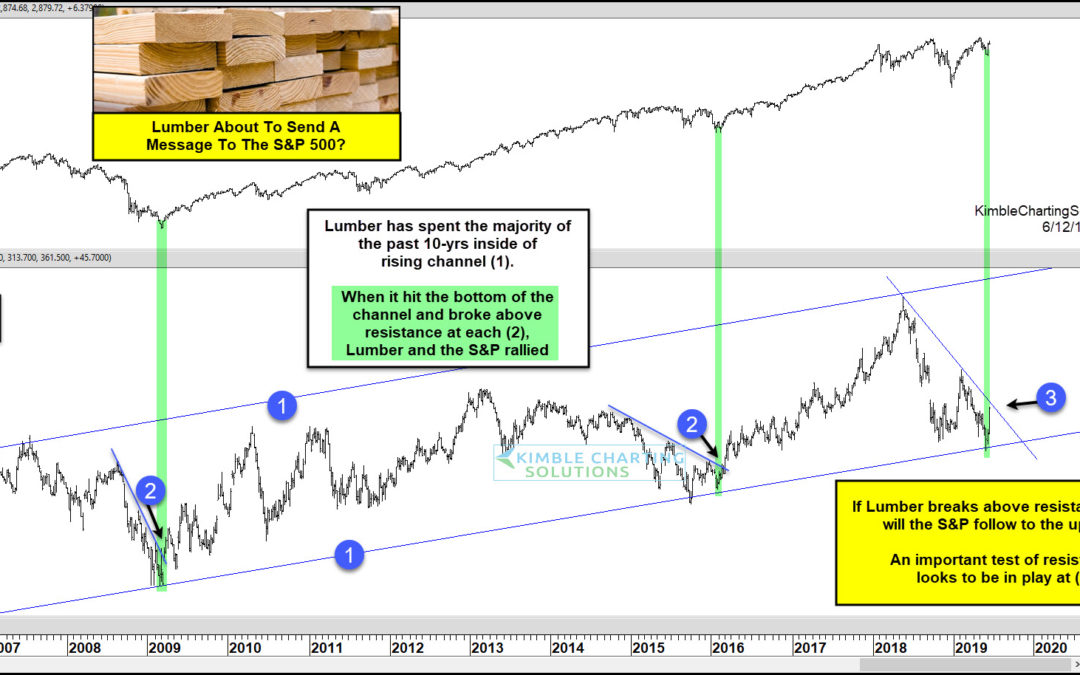
by Chris Kimble | Jun 13, 2019 | Kimble Charting
For the past decade, Lumber prices have traded within a broad rising trend channel. See (1) on the lumber “weekly” price chart above. Recently lumber prices hit the bottom of that channel and began to bounce higher. This could be good news for the S&P 500 Index...
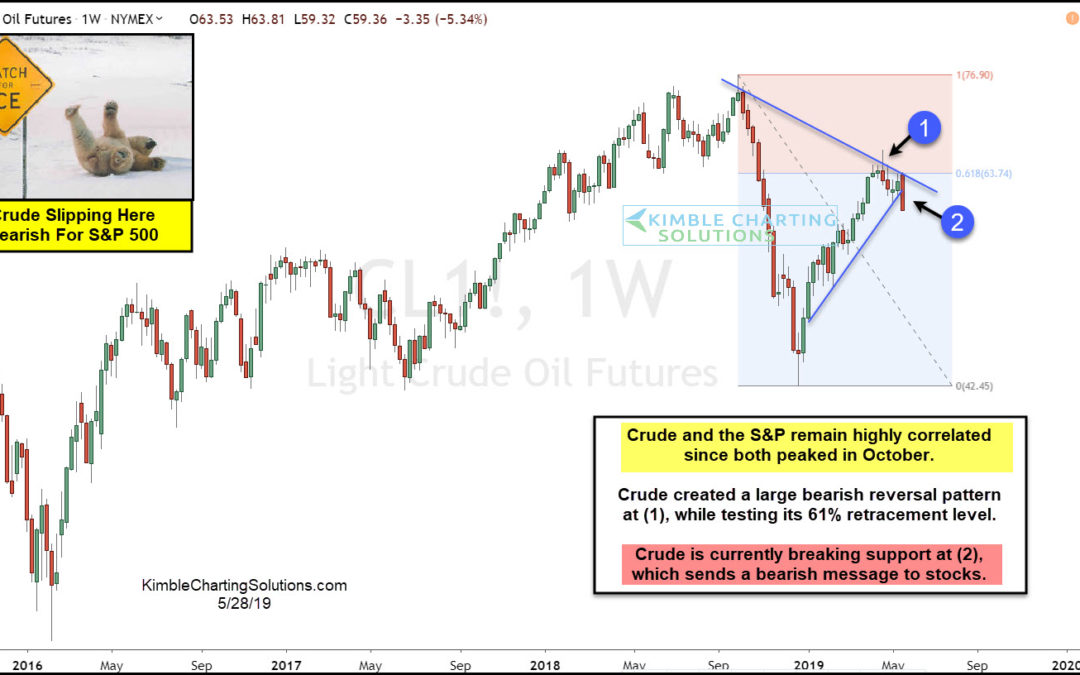
by Chris Kimble | May 28, 2019 | Kimble Charting
A couple of weeks ago, I wrote an article about crude oil’s recent correlation to the S&P 500 (stock market) and that its initial move lower may be sending a bearish signal to stocks. Since then, crude oil has fallen sharply through its up-trend line,...

by Chris Kimble | May 20, 2019 | Kimble Charting
The rally off the December stock market lows has been strong, to say the least. The S&P 500 rallied 25 percent before hitting and testing the 2018 high. The old highs proved to be formidable resistance and ushered in some volatility in May… and a 5 percent...
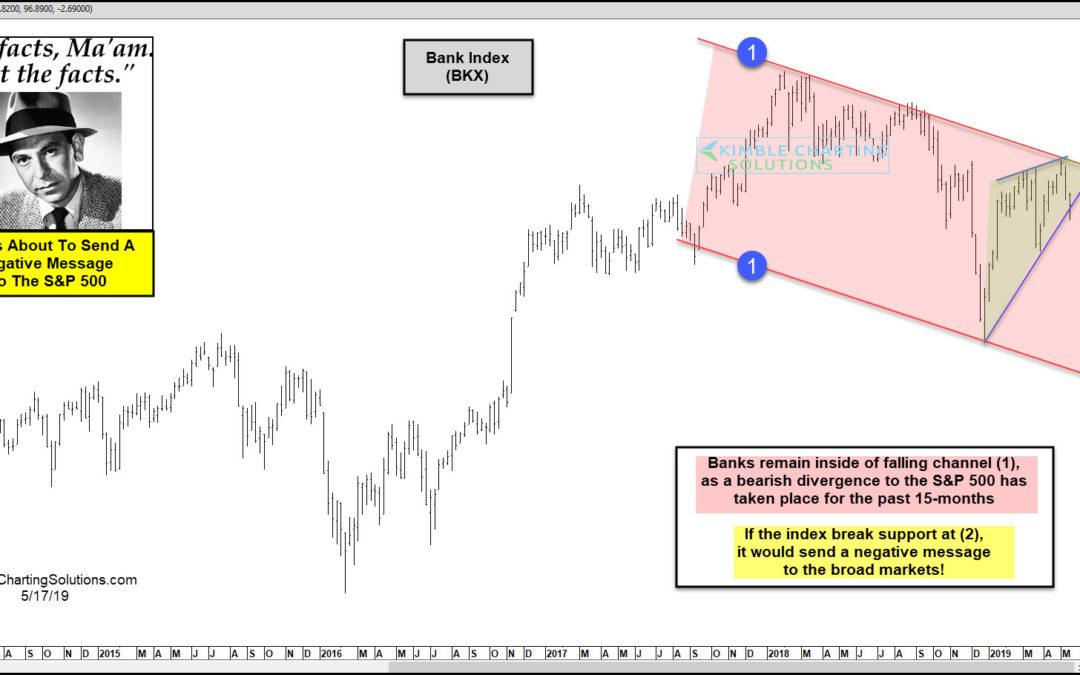
by Chris Kimble | May 17, 2019 | Kimble Charting
Quality bull markets prefer to see Banks stronger than the broad markets or at least keeping up with it. Concerns often crop up when banks reflect relative weakness compared to the S&P. This chart looks at the Bank Index (BKX) over the past few years, reflecting a...
