by Chris Kimble | Oct 12, 2018 | Kimble Charting
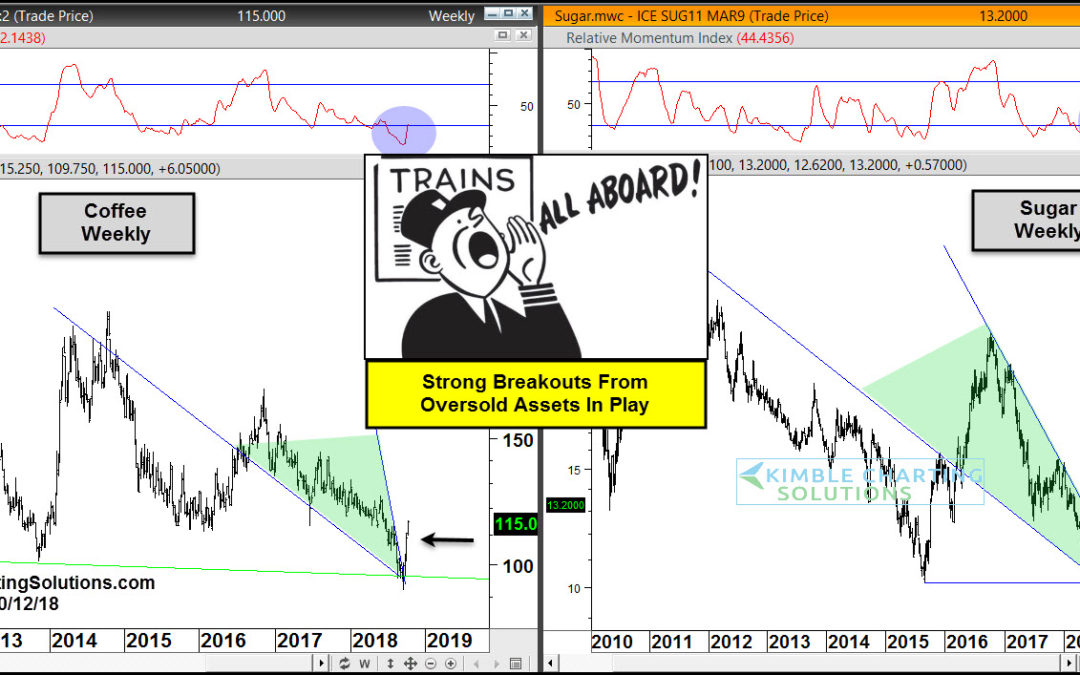
CLICK ON CHART TO ENLARGE Two weeks ago the Power of the Pattern shared that bullish opportunities were forming in two hard-hit commodity ETF’s. Above is an update of what these patterns look like 10-days after the original posts. On 10/2 we shared this post;...

by Chris Kimble | Oct 1, 2018 | Kimble Charting
CLICK ON CHART TO ENLARGE Sugar has experienced some sour times over the past couple of years, as it has declined nearly 50%. Could these declines be creating a “sweet opportunity?” Possible! Sugar has spent the majority of the past 30-Years inside of...
by Chris Kimble | Jun 6, 2018 | Kimble Charting
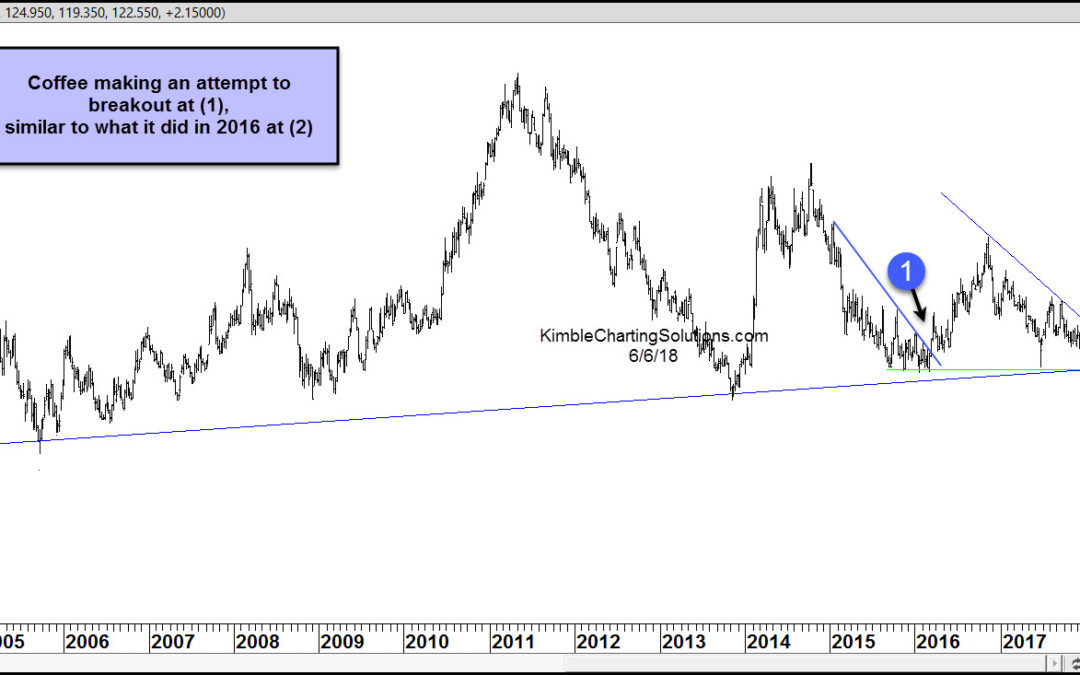
On Monday, we highlighted an important price pattern in the chart of the Thomson Reuters Equal-Weighted Commodities Index. Today, we’ll stick within that theme and look at two soft commodities trading setups: Coffee and Sugar (futures). In both cases, we have charts...

by Chris Kimble | Jun 7, 2017 | Kimble Charting
Sugar hasn’t been too sweet for those that have been long it for the past 90-days, as Sugar ETF (SGG) has lost a third of its value. Could Sugar be about to turn sweet for those long the ETF? Check out where the large decline has SGG at this time- CLICK ON CHART...

by Chris Kimble | Jan 15, 2014 | Kimble Charting, Sector / Commodity
CLICK ON CHART TO ENLARGE Ever heard of the idea of buy low & sell higher? Believe in it? If not quit reading now! If you do believe in the idea of buy low & sell higher or believe in buying assets that are out of favor, the above chart might be of...
by Chris Kimble | Dec 23, 2013 | Kimble Charting, Sector / Commodity
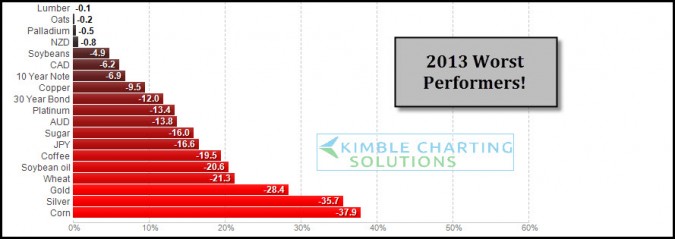
CLICK ON CHART ENLARGE 2013 has been good for stocks, the above table reflects its not been the best of years for certain assets. These are the worst performers so far YTD. As 2013 is nearing a close I wanted to share these worst performers and apply some Power of the...
by Chris Kimble | Jun 28, 2011 | Kimble Charting
Sugar has done a decent job at suggesting the future direction of interest rates over the past couple of years. On 5/31 Sugar was suggesting that rates should be moving higher. (see post here) In the chart below, Sugar has pushed a good deal above...

by Chris Kimble | Jun 2, 2011 | Kimble Charting
CLICK ON CHART TO ENLARGE Even though yesterday was a rough day for equities, a key markets above DID NOT break support! CLICK ON CHART TO ENLARGE I have been sharing that Sugar has been a decent indicator per the future directions of interest rates (see post...
