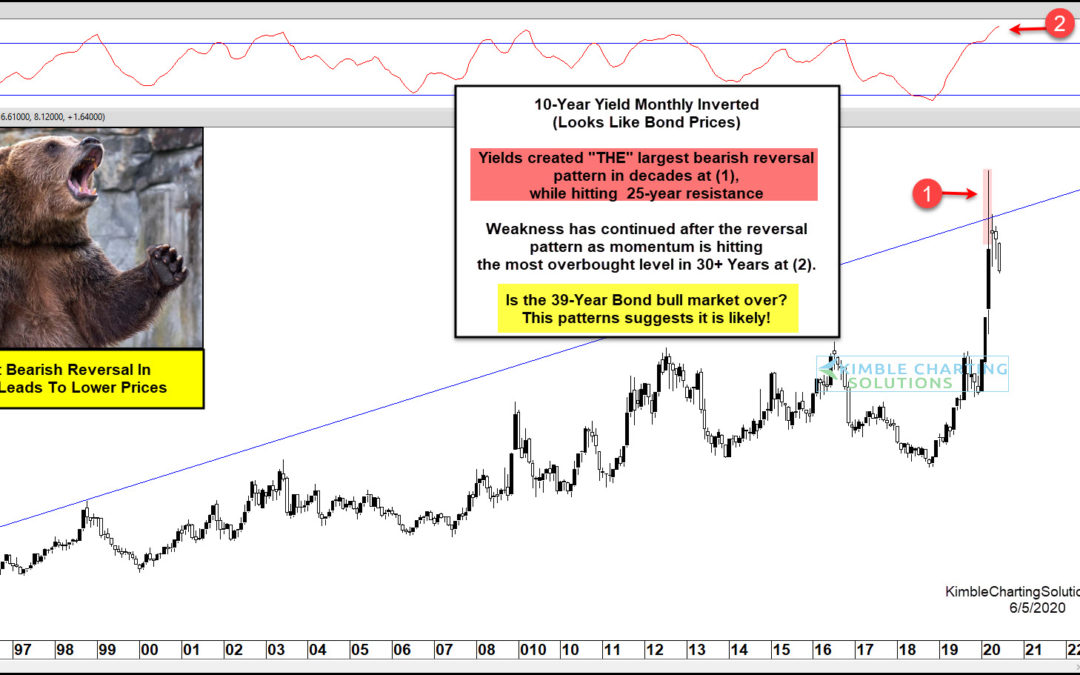
by Chris Kimble | Jun 5, 2020 | Kimble Charting
10 Year US Treasury Bond Yield “inverted” Chart This chart should look familiar, as I’ve shared and updated it a few times to alert clients and readers. It is the 10 Year US Treasury Yield Chart… inverted. As you know, bond yields and price move in opposite...
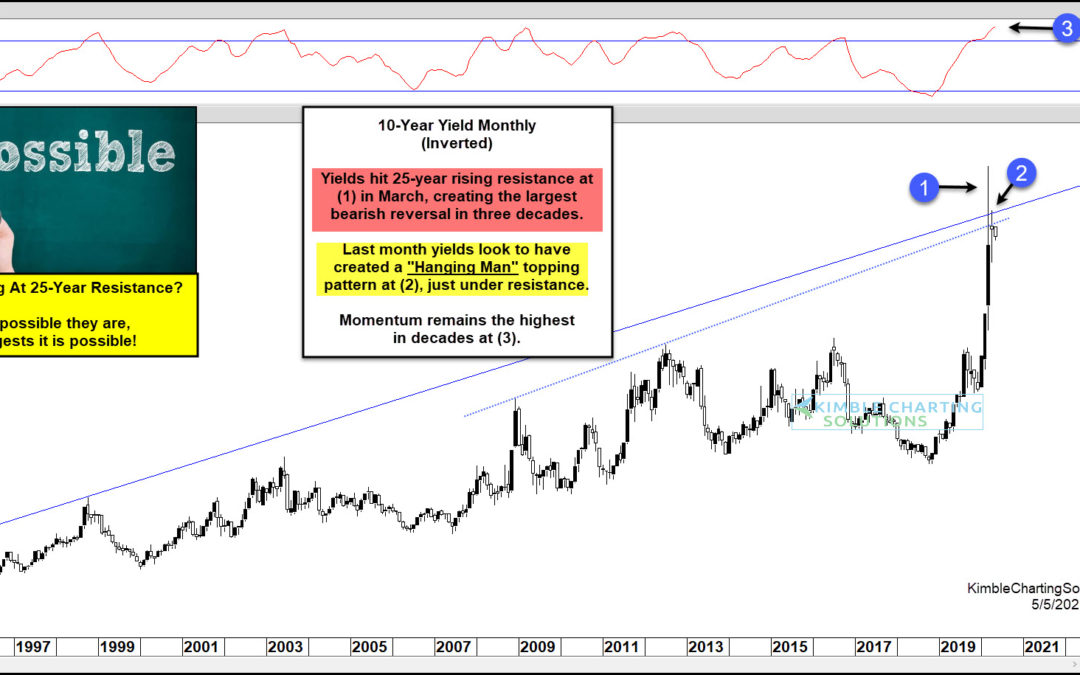
by Chris Kimble | May 6, 2020 | Kimble Charting
If treasury bonds aren’t on your radar, they should be. Many investors and mom and pops own treasury bonds, whether it be a retirement account or pension. Last month, I wrote an article about the potential for a reversal on the 30-Year US Treasury Bond by looking at...
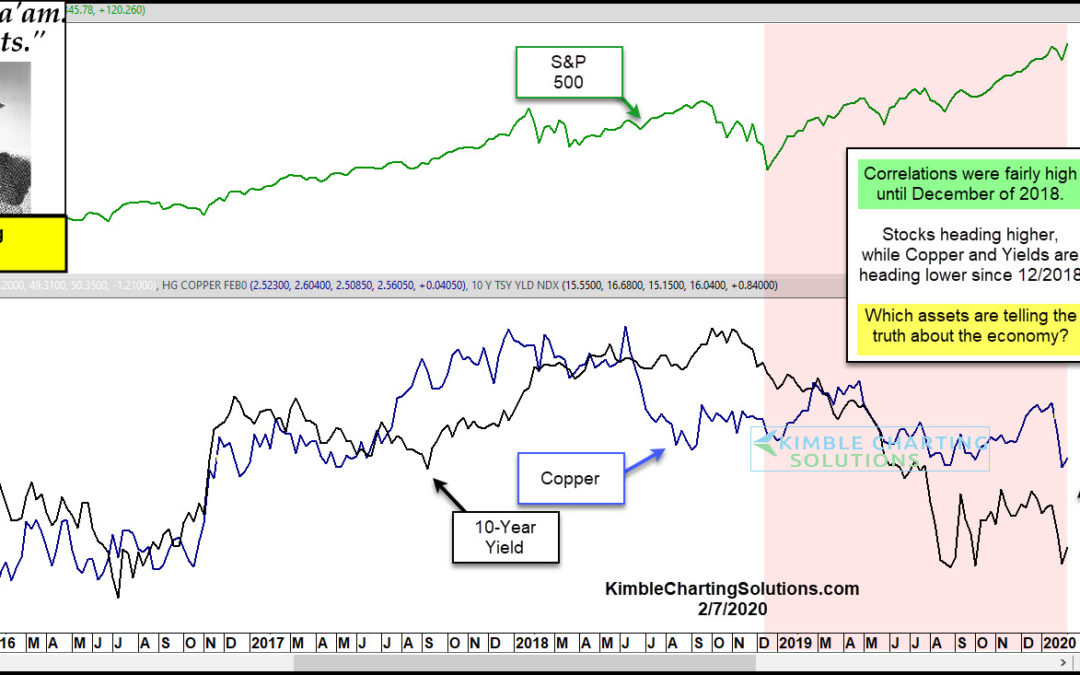
by Chris Kimble | Feb 7, 2020 | Kimble Charting
Historically Stocks, Yields and Doc Copper often trend in the same direction. Unless its different this time, one asset(s) is way out of whack! This chart looks at the S&P 500, Doc Copper and the Yield on the 10-year note over the past 5-years. From late 2015...

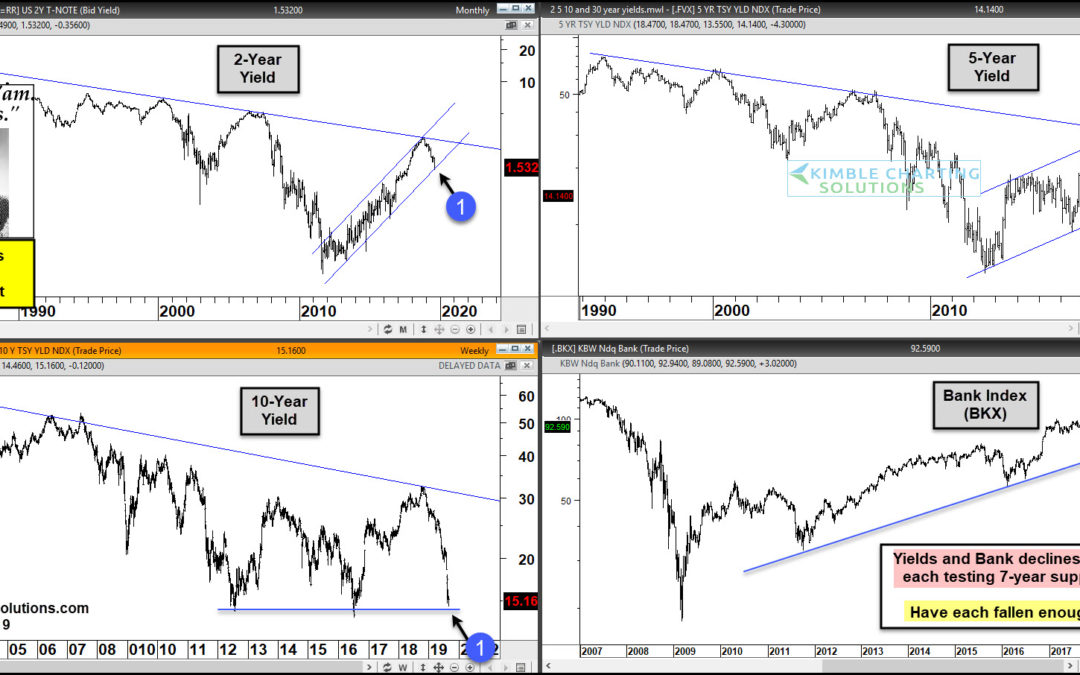
by Chris Kimble | Sep 11, 2019 | Kimble Charting
U.S. Treasury Bond Yields – 2, 5, 10, 30 Year Durations The past year has seen treasury bond yields decline sharply, yet in an orderly fashion. This has spurred recession concerns for much of 2019. Needless to say, it’s a confusing time for investors. In today’s chart...

by Chris Kimble | Sep 7, 2019 | Kimble Charting
The rally in Silver prices has been fast and furious, producing a steep up-trend in the Silver ETF and Silver Futures charts. A similar rally can be seen in treasury bond yields, specifically the 10-Year Treasury Bond Yield In fact, treasury bond yields and silver...
by Chris Kimble | Aug 30, 2019 | Kimble Charting
In the past 5-weeks, 10-Year Yields have declined 26%, 5-year yields are down 24% and 2-year yields are down 17%. Is there more of a decline in yields to come? How would stocks react if yields rally off support? Could bank start reflecting relative strength if yields...
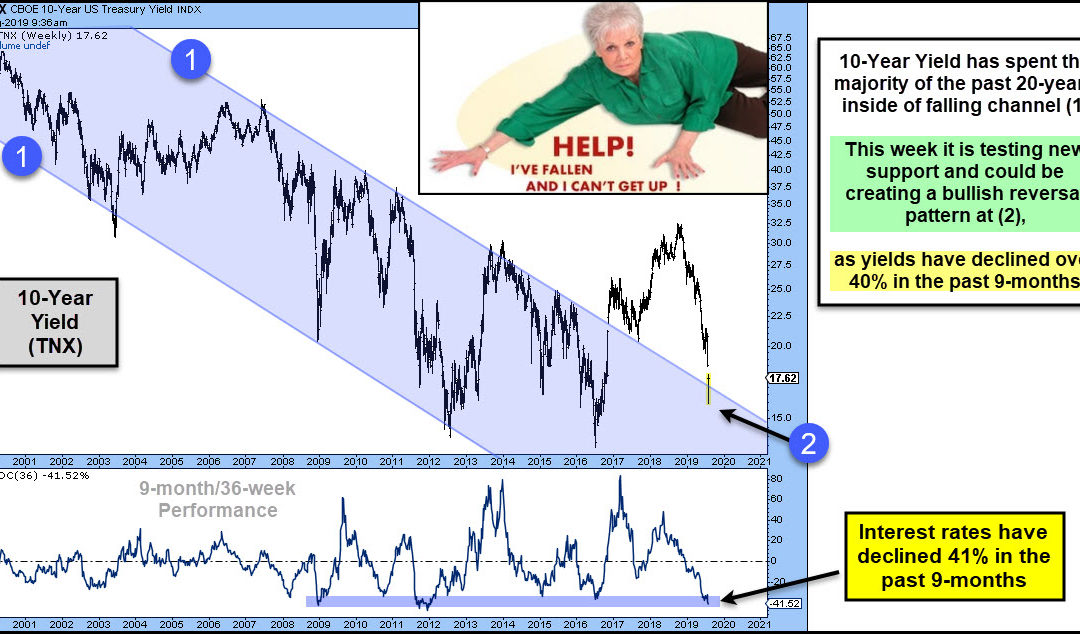
by Chris Kimble | Aug 8, 2019 | Kimble Charting
Interest rates have declined over 40% in the past 9-months. Could they be near a short-term low? Stocks most likely hope so. This chart looks at the yield on the 10-year note (TNX) over the past 20-years. The majority of the past couple of decades rates have declined...
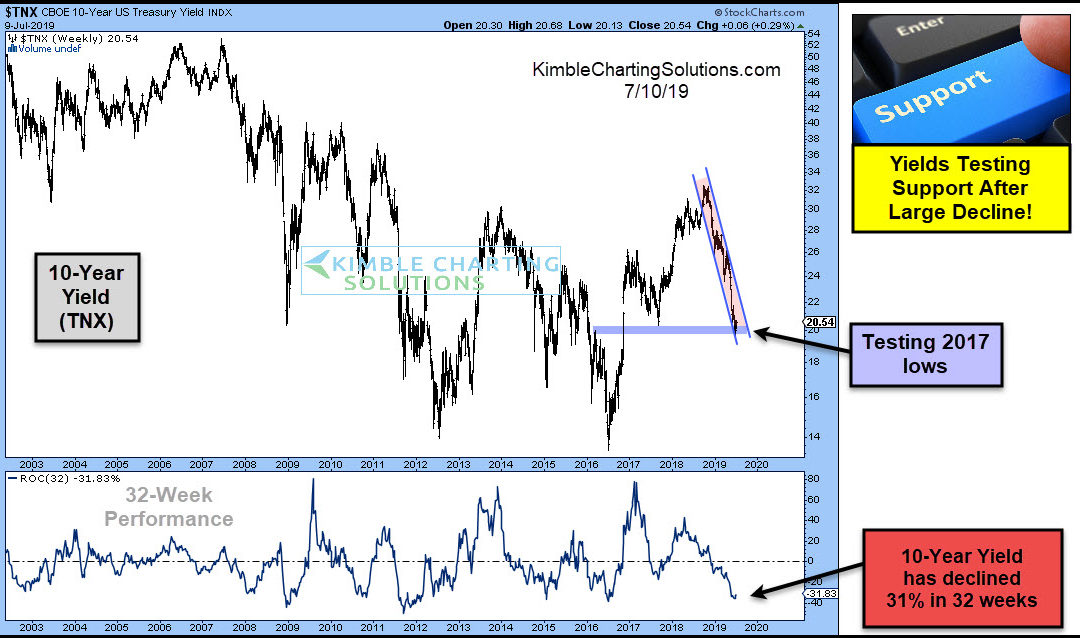
by Chris Kimble | Jul 10, 2019 | Kimble Charting
Will the Fed lower interest rates today? They could if they follow the yield on the 10-year note over the past 32-weeks! This chart reflects that the yield on the 10-year note (TNX) has declined 31% in the past 32-weeks. This decline has yields testing 2017 lows while...
