by Chris Kimble | Apr 2, 2013 | Kimble Charting
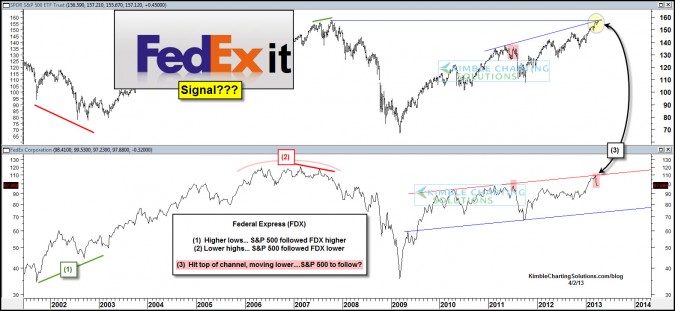
CLICK ON CHART TO ENLARGE Federal Express has been a good leading indicator for the S&P 500 over the past 10 YEARS! Back in 2002, FDX created higher lows and the SPY followed. In 2006/2007 FDX created lower highs and the SPY followed it down. Now Fed...

by Chris Kimble | Feb 19, 2013 | Kimble Charting
CLICK ON CHART TO ENLARGE When the DJ Trucking Index broke support back in July of 2011, the S&P 500 declined around 15% in the following 90 days at (1) in the above chart. The Trucking index has declined 7% in less than a month, after hitting its 2011 highs. The...

by Chris Kimble | Feb 7, 2013 | Kimble Charting
CLICK ON CHART TO ENLARGE The DJ Trucking index’s rallied 30% since last summer which has taken it back to its 2011 highs. Yesterdays 4% decline in this index does not make a trend, yet it is worth watching their action in the upcoming days because it is...
by Chris Kimble | Dec 11, 2012 | Kimble Charting
On 11/20 the Power of the Pattern reflected that the DJ Railroad index was creating a bullish pattern, which could be sending a positive message for this index, the broad market and maybe the economy as a whole. (see bullish railroad post) CLICK ON CHART TO ENLARGE...
by Chris Kimble | Nov 6, 2012 | Kimble Charting
CLICK ON CHART TO ENLARGE The DJ Trucking index remains inside of its rising channel, moving from the top of the channel to the bottom since May of 2011. Now the index is up against a 18-month old falling resistance line that has kept it in check several times. ...
by Chris Kimble | Aug 2, 2012 | Kimble Charting
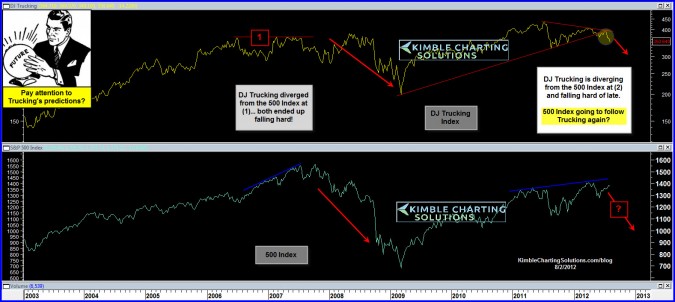
CLICK ON CHART TO ENLARGE The DJ Trucking Index reflected weakness back in 2007, diverging from the S&P 500 and in time both fell in price. Since early last year, the Trucking index is creating a series of lower highs, diverging from the pattern of the S&P 500...

by Chris Kimble | Jul 23, 2012 | Kimble Charting
CLICK ON CHART TO ENLARGE The DJ Trucking index broke down from a flag/pennant pattern back in 2008 at (2) above…. falling 50% in 6 months. Now the Trucking index broke below another flag pattern of late, kissed the underside of resistance at (4) and is...

by Chris Kimble | Aug 5, 2011 | Kimble Charting
The chart below was posted on 7/28, reflecting that negative patterns in the leading transportation industry was at hand and they were suggesting that gravity can be pretty painful and Ole Wiley was waving good bye to current prices.. (See post here) IYT and the DJ...
