by Chris Kimble | Oct 18, 2023 | Kimble Charting
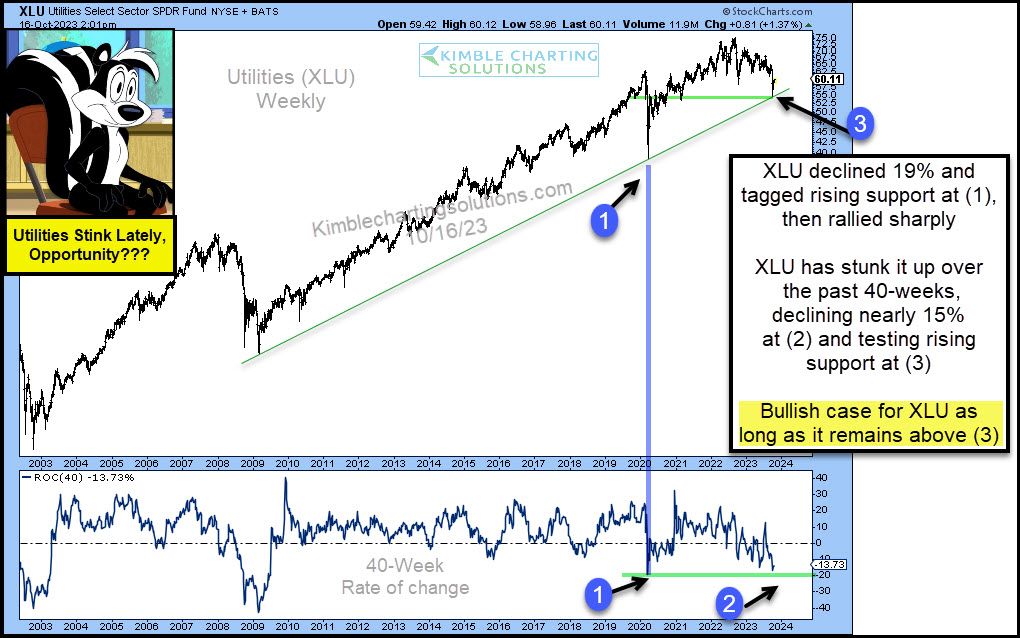
It’s been a tough environment for the Utilities Sector. The ETF (XLU) has underperformed for months and really stunk it up in recent weeks. Looking at the chart below, you can see that XLU declined 19% in 2020, tagging its uptrend line at (1) before rallying sharply....
by Chris Kimble | Mar 3, 2023 | Kimble Charting
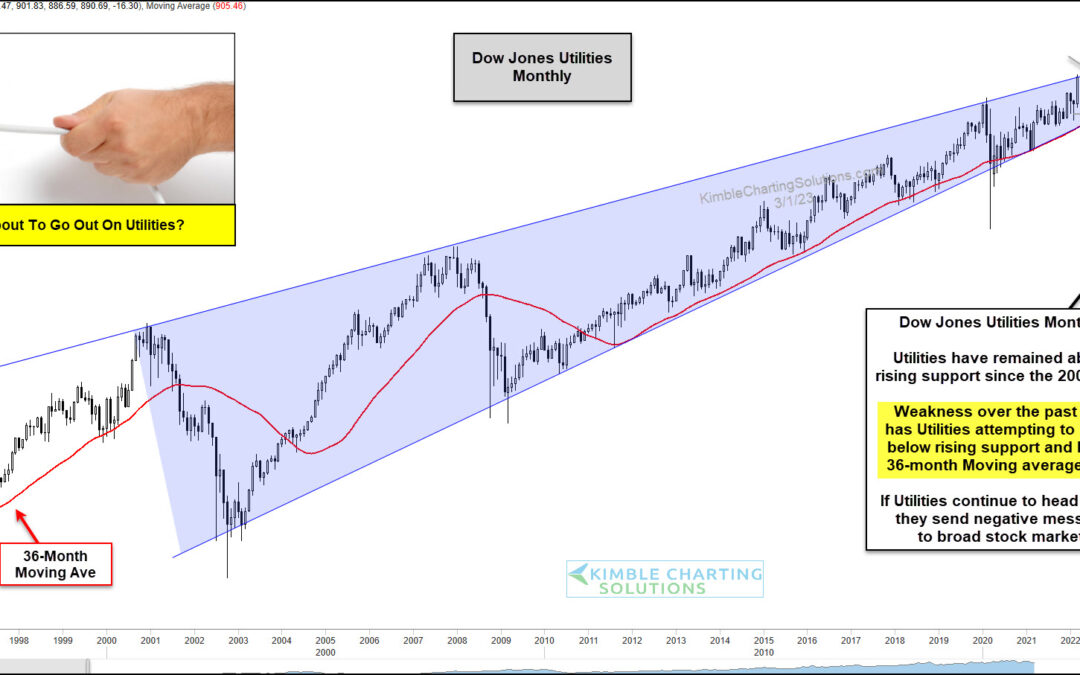
The Dow Jones Utilities Average has enjoyed a 20-year bullish rising price trend. But a recent multi-month sell-off has bulls on the ropes and wondering if the lights are about to go out on utilities. Today’s chart is a long-term “monthly” chart of the Dow Jones...

by Chris Kimble | Feb 22, 2023 | Kimble Charting
Utilities stocks have been in a long-term uptrend over the last 20 years. This tremendous trend can be seen in the “monthly” chart of the Dow Jones Utilities Index below. Note, however, that the rising trend channel is quite wide. And within this wide trend channel...

by Chris Kimble | Feb 10, 2018 | Kimble Charting
Market declines and under performance can create opportunities. The table below looks at performance of the S&P 500 sectors over the past 90-days. As you can see the S&P has pretty much went nowhere, yet two different sectors have been hit hard! CLICK ON CHART...
by Chris Kimble | Jan 10, 2018 | Kimble Charting
Utilities ETF XLU has had a rough go of it the past two months! Below compares XLU to the S&P 500 over the past year- CLICK ON CHART TO ENLARGE Sometimes Utilities are viewed as interest-sensitive assets. XLU was keeping pace with the S&P over the past year...

by Chris Kimble | Nov 22, 2016 | Kimble Charting
Rate sensitive assets have experienced rare moves since July. Government bonds (TLT), Utilities (XLU) and Real Estate (IYR) have fallen hard, as interest rates have risen of sharply. Have rates hit a peak or are they just getting started, on a much greater move much...

by Chris Kimble | Mar 1, 2016 | Kimble Charting
CLICK ON CHART TO ENLARGE Two times in the past 7-weeks the S&P 500, on a weekly basis, has created bullish reversal patterns (bullish wicks) at 2-year horizontal support. At nearly the same time, interest sensitive Government Bond ETF (TLT) and Utilities (XLU)...

by Chris Kimble | Dec 29, 2015 | Kimble Charting
CLICK ON CHART TO ENLARGE It’s been a rough year for the Dow Jones Utilities Index, as its declined 7% more than the S&P 500, so far this year. (See inset table) While doing poor this year, the index has remained above rising support and has made a series of...
