by Chris Kimble | Nov 17, 2020 | Kimble Charting
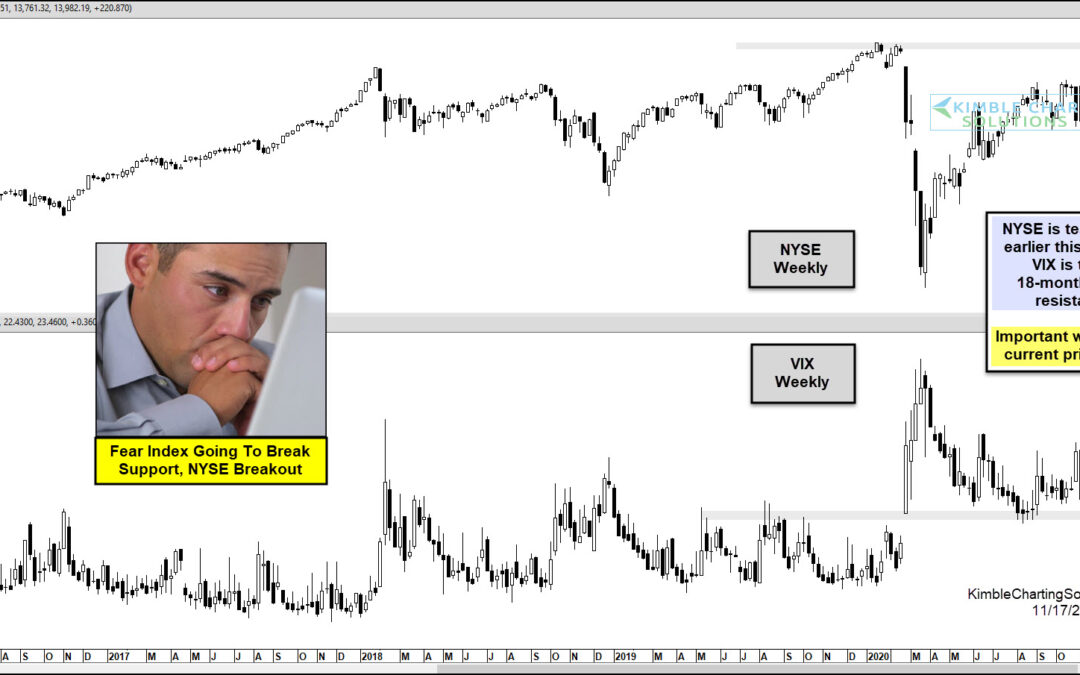
Is a key broad market index about to breakout? YES! With the trend being up for the NYSE index, a key breakout test is in play in the top half of the chart above. At the same time, the fear index (VIX) is testing a support & resistance line, that has been in play...

by Chris Kimble | May 10, 2017 | Kimble Charting
Below looks at the VIX index over the past decade. Over the past three weeks, the VIX has been falling sharply, over 40%. This decline has our attention from a Power of the Pattern perspective, see why below. CLICK ON CHART TO ENLARGE Over the past 7-years, the VIX...

by Chris Kimble | May 9, 2017 | Kimble Charting
Three weeks ago yesterday, the Fear Index (VIX), was pushing sharply higher, on a very small decline in the S&P 500. When this happened, the Power of the Pattern was suggest to go against the crowd. Below looks at the VIX index over the past 10-years. CLICK ON...

by Chris Kimble | Feb 17, 2017 | Kimble Charting
Markets have been on a steady rise and the same can be said for Inverse Fear ETF (XIV). Below looks at Inverse Fear ETF (XIV) since the lows in 2011. CLICK ON CHART TO ENLARGE What a difference a year can make! One year ago this week, XIV was testing rising channel...

by Chris Kimble | Aug 25, 2015 | Kimble Charting
CLICK ON CHART TO ENLARGE Did investors get ahead of themselves the past couple of days? From a fear perspective, it looks like they might have! This chart looks at the Fear Index (VIX) over the past 25-years. As you can see, the VIX has only reached the 48 level, 8...

by Chris Kimble | Mar 4, 2015 | Kimble Charting
CLICK ON CHART TO ENLARGE The chart below looks back on the past 31 days and reflects that the S&P 500 did well (up over 5%). During this rally, investors confidence grew and fear levels fell hard (over 30%). The above chart takes a look at the VIX index, which...
by Chris Kimble | Feb 27, 2015 | Kimble Charting
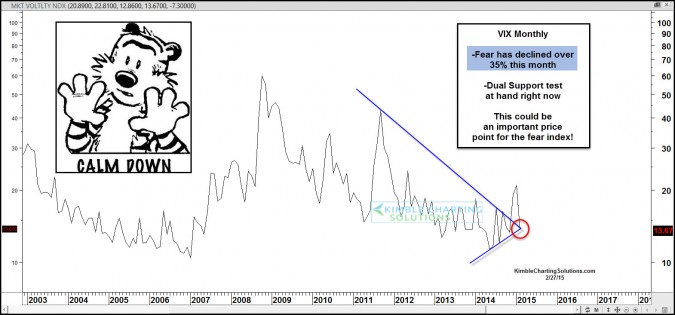
CLICK ON CHART TO ENLARGE Its been a good month for stocks, as the S&P is up over 5%, one of the stronger February’s in a long time. As you might suspect if the market is up, the fear index is often down. The VIX index is down almost 35% this month. The...

by Chris Kimble | Feb 12, 2015 | Kimble Charting
CLICK ON CHART TO ENLARGE The Fear index (VIX) has remained at lofty levels for an unusual length of time, attempting to break above long-term resistance. The VIX almost appears to have made a “Triple Top” at this long-term resistance line at (1) above....
