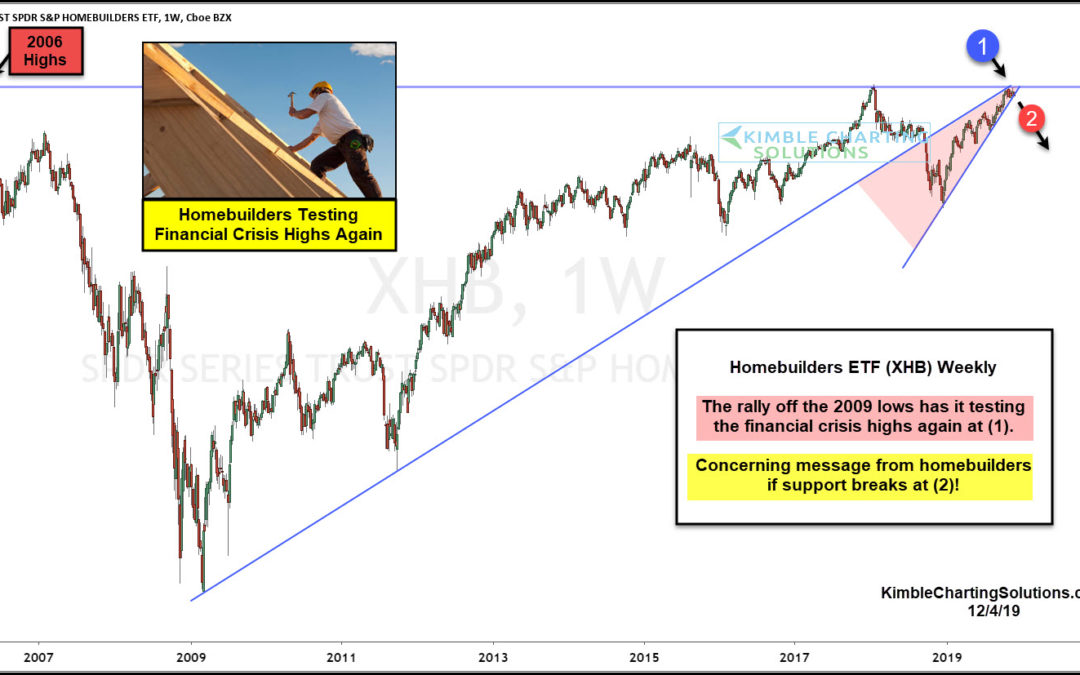
by Chris Kimble | Dec 4, 2019 | Kimble Charting
The latest leg higher for the bull market has been supported by a resilient U.S. economy that continues to climb a wall of worry. And that theme has carried over to the stock market. This has helped stocks rise over 20 percent in 2019. One core piece of the economy is...
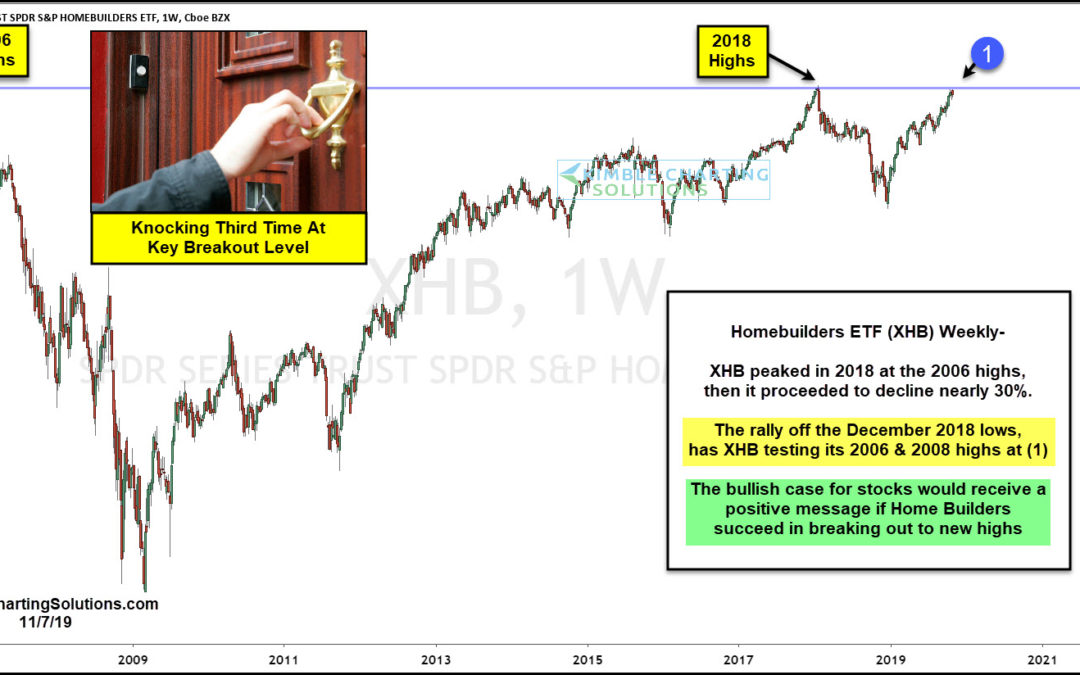
by Chris Kimble | Nov 7, 2019 | Kimble Charting
Is a very important sector of the U.S. economy about to experience a 13-year breakout? Possible! This chart looks at Homebuilders ETF (XHB) over the past 13-years. XHB peaked in 2016, almost a year before the broad market started feeling the impact of the upcoming...
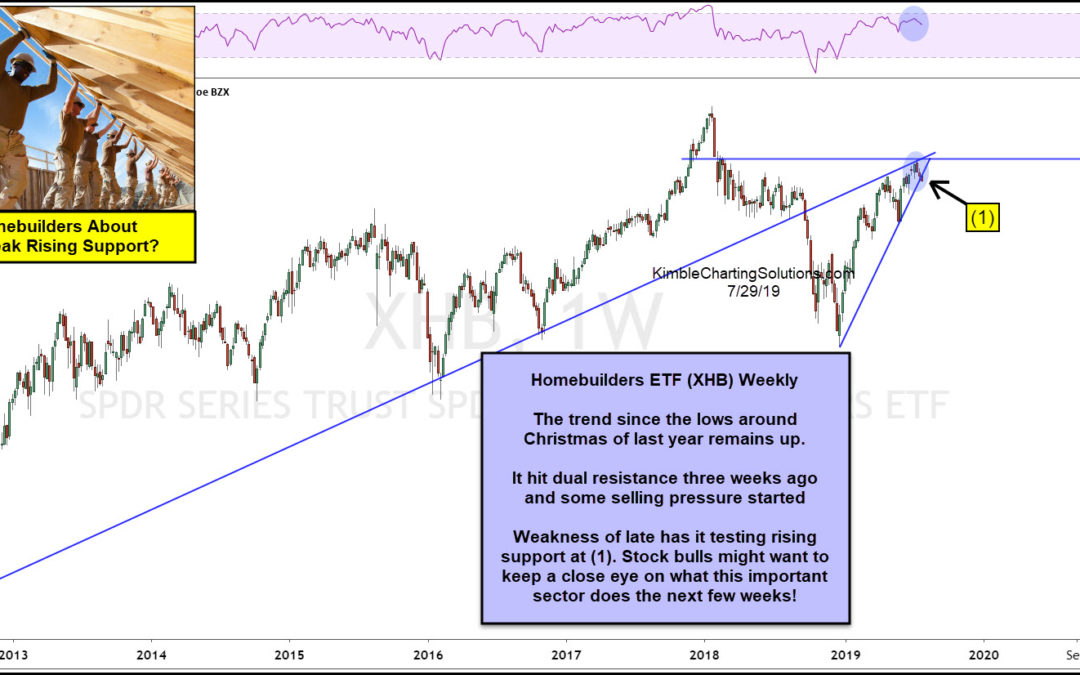
by Chris Kimble | Jul 29, 2019 | Kimble Charting
Sometimes the ole phrase “So Goes Homebuilders, So Goes The Economy Is True!” This chart looks at an important sector of our economy, which is the Homebuilders ETF (XHB). The long-term trend remains up, yet over the past year, it is experiencing a negative...
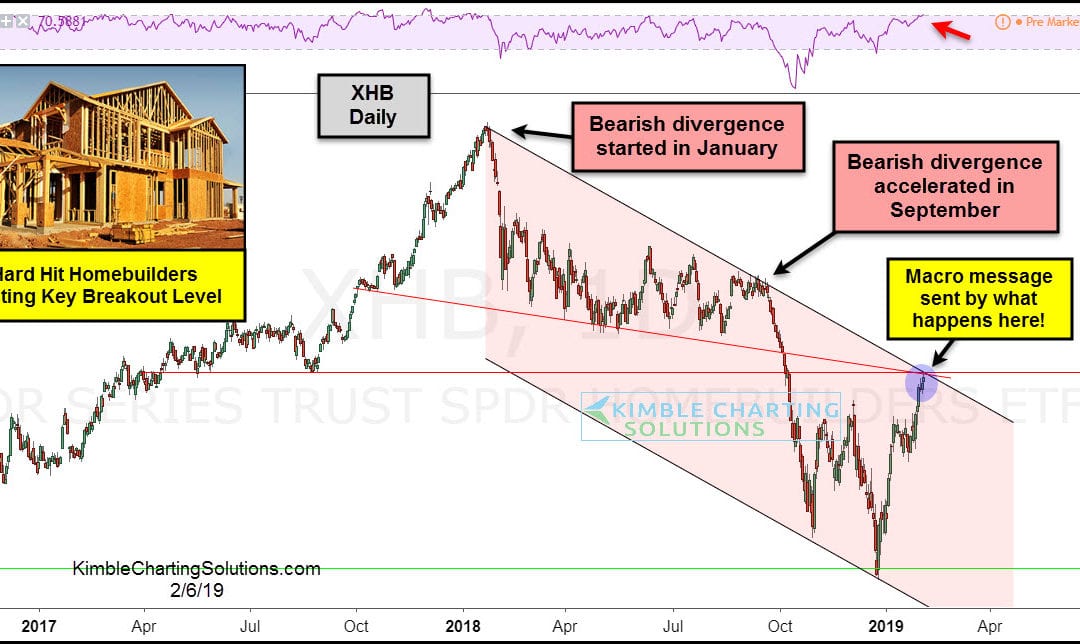
by Chris Kimble | Feb 7, 2019 | Kimble Charting
Housing and home building related stocks have been hit hard over the past year. Case in point: The Homebuilders ETF (NYSEARCA: XHB). Looking at the chart below, it’s clear that the Homebuilders (XHB) have been in a downtrend since last January of last year (see pink...
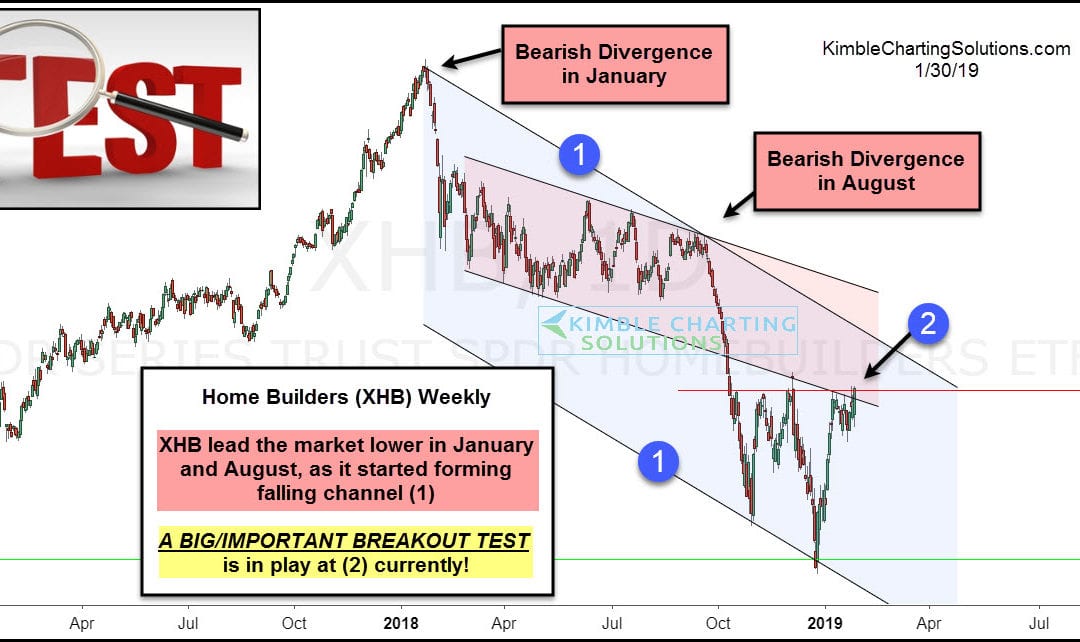
by Chris Kimble | Jan 30, 2019 | Kimble Charting
Homebuilder ETF (XHB) has sent leading signals to the broad market since the highs in 2007 and another very important signal could be sent by what they do at current prices. XHB started experiencing a bearish divergence in January and August of 2018, as it reflected...
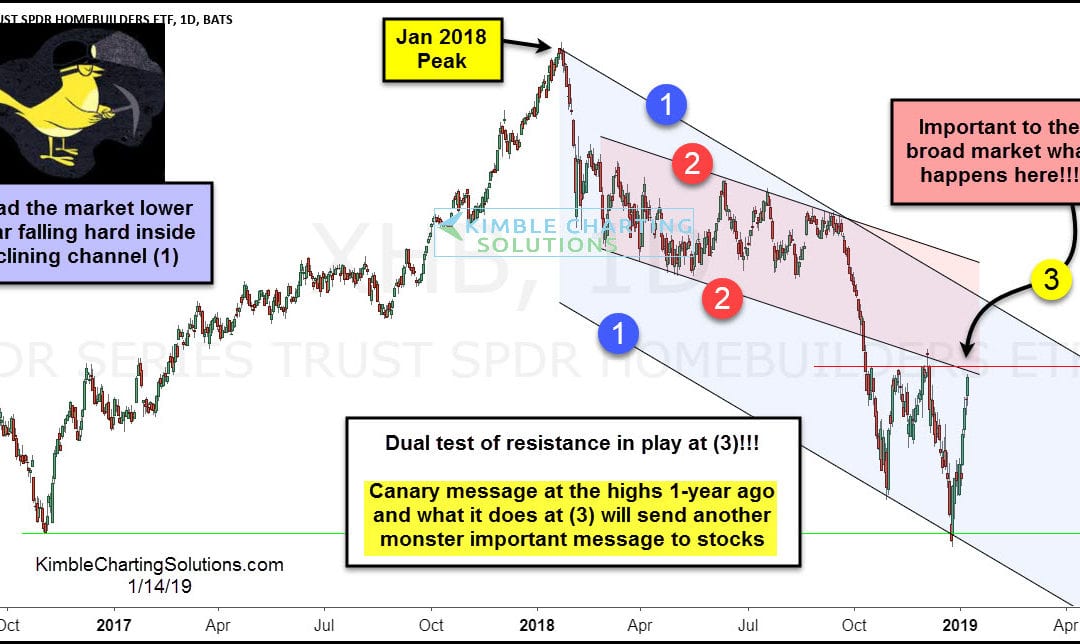
by Chris Kimble | Jan 14, 2019 | Kimble Charting
There are often market “tells” that occur long before the beginning of a broader stock market rally or correction. And they tend to be sectors/areas of the market that are more sensitive to the economy… for instance, small cap stocks, tech/growth stocks, housing...
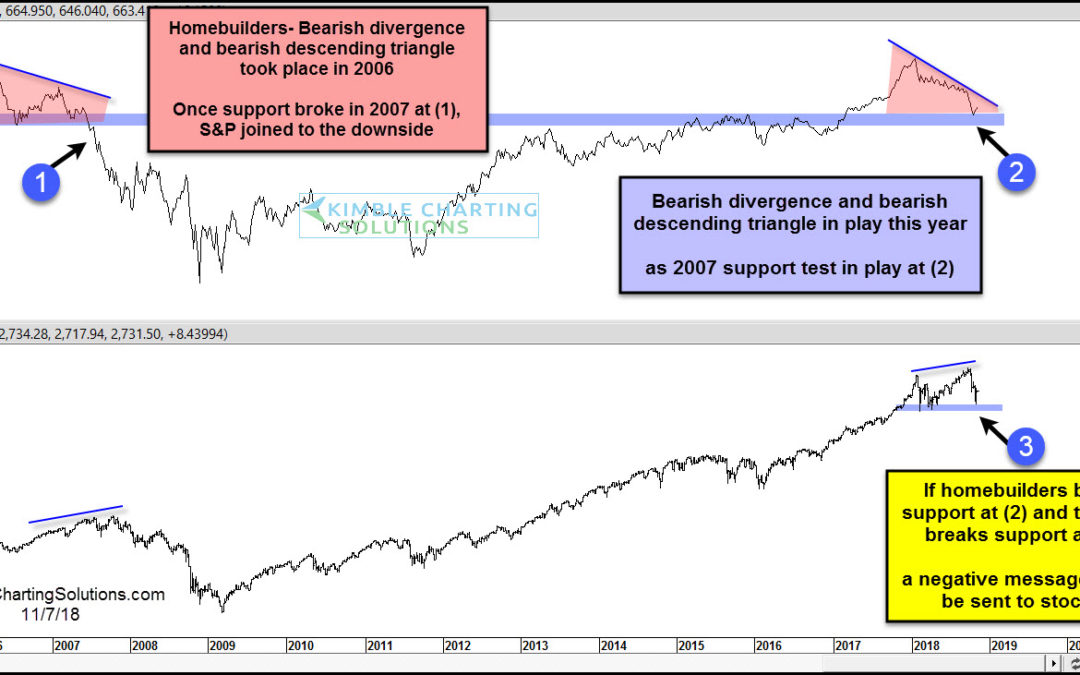
by Chris Kimble | Nov 8, 2018 | Kimble Charting
Housing market concerns are bubbling up once again. Remember the 2007 housing bubble? Well this may not end the same way, but it’s definitely worth noting the weakness in the housing sector. Especially the homebuilders (via the Dow Jones Home Construction Index). Take...
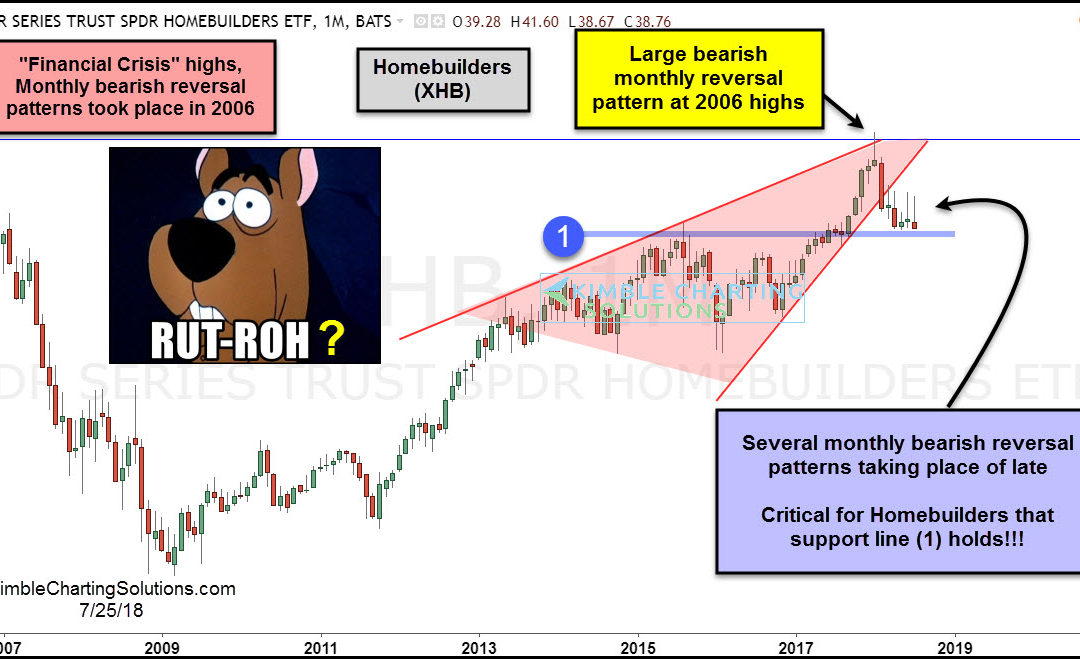
by Chris Kimble | Jul 27, 2018 | Kimble Charting
Are the Homebuilders experiencing a case of Deja Vu? Is it 2006 all over again? Looking at a monthly chart of the Homebuilders ETF (NYSEARCA: XHB), you can see that a series of bearish reversals took shape back in 2006, just prior to the financial crisis. Fast forward...
