
by Chris Kimble | Apr 6, 2018 | Kimble Charting
CLICK ON CHART TO ENLARGE This chart looks at the Bank Index over the past 17-years on a monthly basis. The index has remained inside of a bullish rising channel (A) since the lows in 2011. The rally over the past 7-years took it to the top of this channel and back to...

by Chris Kimble | Jan 30, 2018 | Kimble Charting
Banks started showing cracks back in 2007 and before long they started breaking support and fell hard. The current bank trend remains UP at this time. The trend finds itself back at 2007 highs, where bulls would NOT want to see selling pressure start taking place!...

by Chris Kimble | Nov 14, 2017 | Kimble Charting
What banks do in the states can impact banks in Europe. The opposite is also true, what banks do in Europe, can send important messages to banks in the states. Below looks at European Bank ETF (EUFN)- CLICK ON CHART TO ENLARGE In our humble opinion, weakness of late...

by Chris Kimble | Oct 24, 2017 | Kimble Charting
Some question if “Pigs Can Fly.” I don’t know if they can or can’t, of late though, Piggy Banks are flying high and breaking out. We have highlighted positive bank patterns of late and three weeks ago we shared that the banking sector was...

by Chris Kimble | Oct 12, 2017 | Kimble Charting
Citi Group doesn’t have much to brag about from a long-term perspective, as it remains 80% off its highs back in 2006. Citi has a good deal to brag about, per the gains it has achieved from its 2009 lows (Up several hundred percent). Below looks at Citi over the...
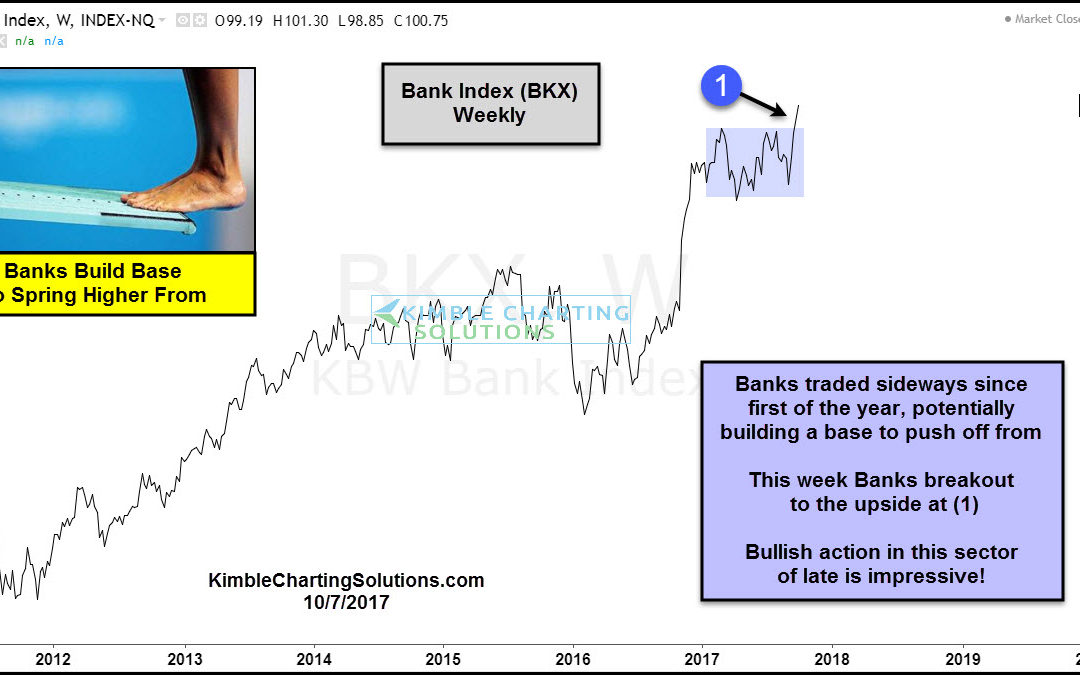
by Chris Kimble | Oct 7, 2017 | Kimble Charting
Since the first of this year, banks didn’t have much to brag about, as they lagged the broad market to the upside. While lagging, they potentially built a base that could reward the owners of banks for a while going forward. Below looks at the Bank Index (BKX)...

by Chris Kimble | Oct 3, 2017 | Kimble Charting
Assets in rising trends often create what is called a “Bullish Flag” pattern. Below looks at the price pattern of Regional Banks ETF (KRE) over the past decade and highlights that a bull flag pattern could be in play. CLICK ON CHART TO ENLARGE Earlier this...

by Chris Kimble | Sep 18, 2017 | Kimble Charting
Citi Group (C) since 2007 highs is much lower in price. Over the past 18-months, its a different story for Citi! Below looks at Citi this year and how it is attempting to breakout from a bullish pattern- CLICK ON CHART TO ENLARGE Over the past few months, Citi appears...
