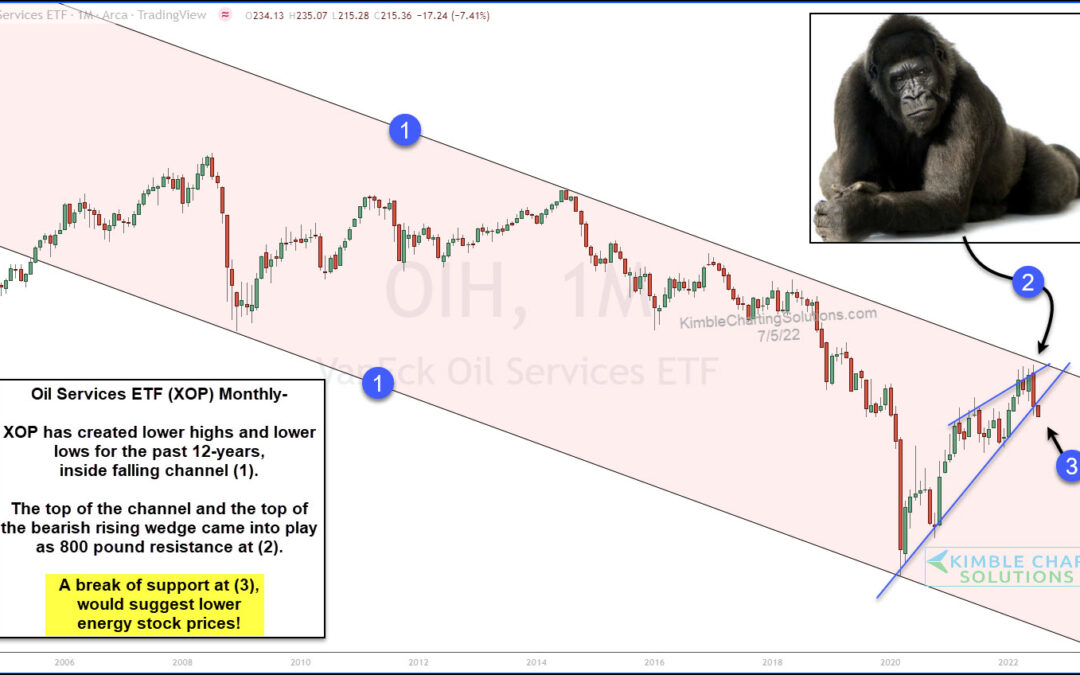
by Chris Kimble | Jul 6, 2022 | Kimble Charting
A couple weeks ago, we warned that energy stocks might be in trouble. We’ve followed and analyzed the entire trend higher for oil and commodities and, now, we are on technical support watch and concerned about commodities breaking down. Today we revisit the Oil...
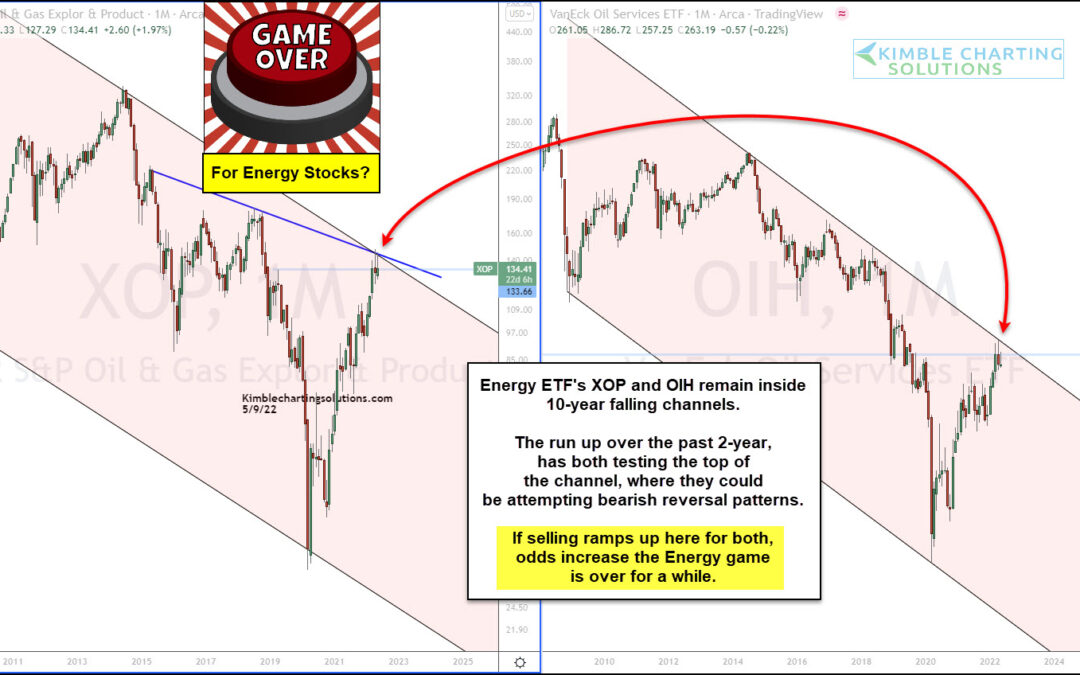
by Chris Kimble | May 10, 2022 | Kimble Charting
There haven’t been many places to hide during this year’s stock market correction (bear market?). And one of the last hiding places could be in trouble: Energy stocks. And more specifically, the Oil and Gas Exploration Sector ETF (XOP) and the Oil Services ETF (OIH)....
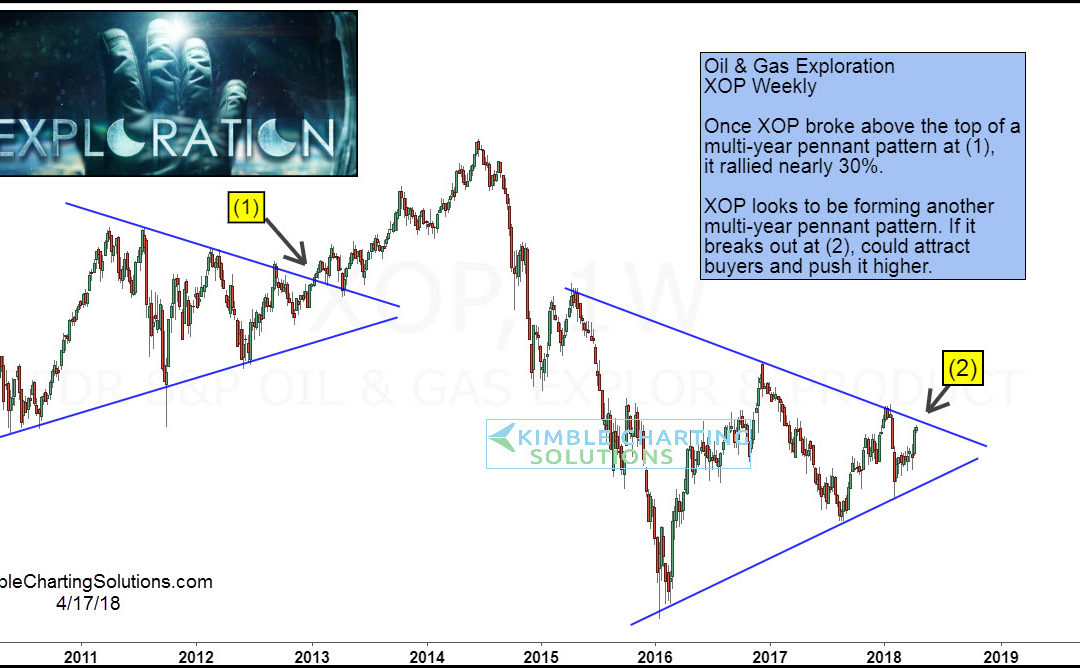
by Chris Kimble | Apr 17, 2018 | Kimble Charting
CLICK ON CHART TO ENLARGE The chart above looks at Oil & Gas Exploration EFT (XOP) over the past 8-years. From 2010 until 2013 it looks to have created a pennant pattern (series of higher lows and lower highs). Once resistance was taken out at (1), buyers came...

by Chris Kimble | Nov 7, 2017 | Kimble Charting
Crude Oil has been strong of late. Did you realize that Crude Oil has gained more in the past month than the S&P 500 has this year, see chart below. CLICK ON CHART TO ENLARGE The strong rally of late has Crude testing what appears to be a very important level in...

by Chris Kimble | Oct 6, 2017 | Kimble Charting
Crude Oil has rallied for the past few months, could it be peaking? Joe Friday suggests Crude finds itself at a key inflection point for it and its Fear Index (OVX). Below looks at Crude Oil futures over the past decade- CLICK ON CHART TO ENLARGE Crude Oil rally of...

by Chris Kimble | Sep 20, 2017 | Kimble Charting
Oil & Gas Exploration stocks have been hit hard over the past few years, falling over 50%. Could an opportunity be at hand in this hard-hit sector? Possible! Below looks at the chart of Oil & Gas Exploration ETF (XOP) over the past few years. CLICK ON CHART TO...

by Chris Kimble | Sep 6, 2017 | Kimble Charting
Oil Drillers have had little to smile about over the past years. Could this trend be about to end? A pattern is in play that highlights a counter trend rally could be near. Below looks at the Oil Drillers (XOP)/ S&P 500 Ratio over the past couple of years- CLICK...

by Chris Kimble | Apr 10, 2017 | Kimble Charting
Crude Oil has created a series of lower highs and lower lows since the peak in 2008. Since the lows of 14-months ago, Crude has created a series of higher lows and potentially creating a bullish ascending triangle pattern. This pattern two-thirds of the time, leads to...
